2
Dr. Kevin Bracker; Dr. Fang Lin; and jpursley
Learning Objectives
After completing this chapter, students should be able to
- Discuss the purpose and key issues associated with the income statement, balance sheet, and statement of cash flows
- Identify the three components of the statement of cash flows and interpret each of the three components
- Calculate and interpret key financial ratios
- Calculate and interpret a common size income statement and common size balance sheet
- Discuss and apply the concept of trend analysis, including both its strengths and weaknesses
- Discuss and apply the concept of comparative analysis, including both its strengths and weaknesses
- Identify key users of financial statement analysis
- Identify potential strengths and weaknesses for a firm, given financial statements for the firm and industry (or competitor)
- Discuss and interpret the many issues associated with financial statement analysis (such as seasonality, context, etc.)
Key Financial Statements
 There are three key financial statements that are important to investors, security analysts, management, and creditors. These are the INCOME STATEMENT, BALANCE SHEET, and STATEMENT OF CASH FLOWS. Note that there is a fourth financial statement (statement of retained earnings) that is provided in financial reports. However, the other three capture the majority of the information needed for financial statement analysis and are where we will focus our attention in this chapter. See the sample financial statements from Wal-Mart and Target in Appendix B. Note that these financial statements are compiled from Yahoo!Finance which attempts to fit financial statements to a (mostly) common template. In practice, financial analysts will use the financial statements provided directly from the company as part of the firm’s 10-Q and 10-K reports required by the SEC. These official statements provide many additional details and notes that are not available from places that provide general financial information, but are essential to providing the context to make maximum use of the financial statements.
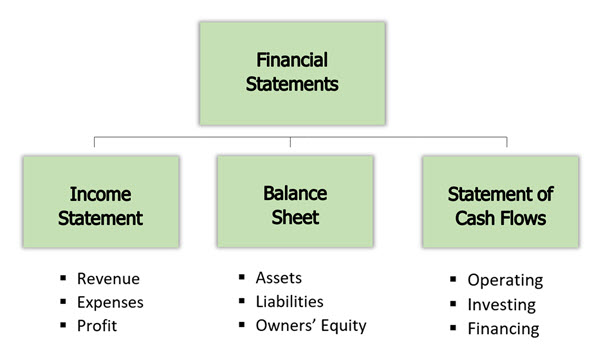
Income Statement
The income statement provides information on the company’s revenues and expenses over a specific time period (usually annually or quarterly). These revenues and expenses are accounting-based and not necessarily reflective of cash flows generated. For example, when a long-term asset is purchased the cash is spent at that time. However, its expenses are recognized over time as depreciation instead of at the point of purchase. Also, the method chosen to account for inventory can cause discrepancies between net income and cash flows from operations. The cost of our inventory is recognized when it is sold not when it is paid for. While the income statement is not cash based, that does not imply that it is meaningless. It still provides a good picture of how well the company is doing, but we must recognize that net income is not cash.
Balance Sheet
The balance sheet provides a snapshot of the company’s assets, liabilities, and owners’ equity at a specific point in time. The company’s assets must be financed by either debt (liabilities) or ownership interest (equity). Therefore, assets will always equal liabilities plus owners equity (A = L + OE). It is important to remember that the values reported on the balance sheet are “book values” and do not necessarily represent the market value of the asset or ownership interest for a variety of reasons:
- The value of brand names, patents and other intellectual property which are often quite valuable to a corporation are not typically recorded on the balance sheet.
- The book (balance sheet) value of assets is based on historical cost less accumulated depreciation. The real (market) value of the assets is based on the ability of the firm to generate cash flows from those assets.
- The market value of a firm may incorporate value from assets that are not actually on the balance sheet, but are anticipated to enhance the firm’s ability to generate cash flows in the future. An example of this would be Tesla, which would likely lose significant market value if Elon Musk was not associated with the company.
Typically, investors are willing to pay more for the firm than the balance sheet tells us it is worth because the balance sheet tends to be a conservative estimate of the true value of the firm’s assets (although sometimes the balance sheet will overstate the market value of the firm’s shares). Also, remember that the balance sheet represents a point in time and may not be the same throughout the year. For example, a company like Wal-Mart may have relatively high inventory and low cash at the end of the 3rd quarter (start of Christmas shopping season) and relatively low inventory at the end of the fourth quarter (end of Christmas shopping season).
Statement of Cash Flows
The statement of cash flows attempts to reconcile the differences between net income according to Generally Accepted Accounting Principles (GAAP) and cash flows. Cash flows are broken down into three primary areas — Cash Flow from Operating Activities, Cash Flow from Investing Activities, and Cash Flow from Financing Activities.
Cash Flow from Operating Activities
This is the most critical component of the statement of cash flows. Cash flow from operating activities provides insights into how well the firm is doing at generating cash flows from its day-to-day operations before factoring in any capital investments or financing issues. This is done by starting with net income and then adjusting back to a cash-based version of income. For example, depreciation lowers net income, but is not a cash expense. Therefore, depreciation is added back in. If our accounts receivable declines, that means we’ve collected additional cash from sales (remember from accounting that revenue is recorded when the sale is made, not when the cash is collected). Therefore, a decline in accounts receivable indicates that our cash flow this period is higher than indicated by our net income. Ideally, we want to see this be positive and growing over time. The idea is that if a firm is going to survive as a going concern it needs to be able to generate positive cash flows from its basic business operations. In addition, investors like to see companies grow over time. As we will see in our chapter on stock valuation, the faster a company grows, all else equal, the more valuable it will be. Sometimes one (or both) of these conditions are not met. If so, it is incumbent on the analyst/management to understand why not and how it can be addressed. Operating cash flows can be negative due to short-term operating problems that are being addressed, due to economic/industry issues, or due to more significant operating problems. The impact on the firm will vary depending on how likely the negative operating cash flows are to be a short-term vs. a long-term issue. Growth, while less important, is also something that analysts/management want to address if it is stagnant or declining.
Cash Flow from Investing Activities
Again, it is important for firm’s to operate as a going concern, which means that they need to invest in their business. This may be updating long-term assets that are getting worn out, spending money on new equipment to improve productivity, or spending money on expanding the business. These investments into long-term assets are commonly referred to as capital expenditures and are essential to a firm remaining competitive and successful. They are also a key element in the cash flow from investing activities segment of the statement of cash flows as they represent investment into the company. Because the firm is spending money on these investments, they will typically be negative (cash outflows). While we want cash flows overall to be positive, negative cash flows from investing activities are not a concern and instead are an essential part of a firm’s long-term success. The reason for concern would be if a firm is underinvesting in its long-term assets or if it is spending too much on unproductive assets. These both can be difficult to identify in the short-run as there is often a lag between when investments are made and when the payoffs show up in the cash flow from operating activities section.
Cash Flow from Financing Activities
If a firm generates more cash flow from its operating activities than it spends on investing activities, it will have cash left over to return to investors (or add to cash balances). Alternatively, if a firm spends more cash flow on its investing activities than it generates from operating activities, it will need to raise additional cash from investors (or draw down cash balances). This is an area that can be as much about where a firm is in its growth cycle as it is about the firm’s health. Typically, younger firms and/or rapidly growing firms need to spend a lot of cash on expanding the business and may not have enough operating cash flows to fund those investing activities. As such, it is common for them to be raising capital by issuing shares of stock or issuing debt and they are unlikely to be using much, if any, cash to pay dividends. This leads to positive cash flows from financing activities. Alternatively, more mature companies are likely to be generating more than enough cash from their operating activities to meet their investment demands. Therefore, they will have cash to pay dividends, buy back outstanding shares of stock, and/or pay back existing debt. This leads to negative cash flows from financing activities. All else equal, negative cash flows from financing activities are a better sign of a company’s health than positive cash flows from financing activities. However, as mentioned above, an analyst needs to consider where the firm is in its growth cycle before jumping to conclusions.
Sample Financial Statements
You can see examples of Garmin’s Financial Statements within the 2019 Garmin Annual Report. Note the Financial Statements start on p. 64 (based on the bottom of the page). You can also see a slide show where Garmin discussed their 2020 3rd Quarter results with investors.
Financial Statements Analysis
Financial Statements provide a wealth of information to many different users. There are many ways to analyze financial statements. These include ratio analysis and common size statements both of which can be analyzed through trend analysis or comparative analysis (we will go into more detail on trend analysis and comparative analysis in a little bit). While ratio analysis and common size statements provide an excellent way to analyze the information in the income statement and balance sheet, the statement of cash flows is best analyzed by breaking it down into its three primary components as discussed earlier.
Key Financial Ratios
There are a large variety of different financial ratios that attempt to evaluate different aspects of a company’s health and performance. Some of these are specific to certain industries. For example, a popular ratio for brick-and-mortar retailers is sales-per-square-foot as it addresses how well the retailer is using its floor space to generate revenue. However, this same ratio would not make sense in evaluating the performance of a heavy equipment manufacturer like Caterpillar. Another challenge with ratios is that they can be calculated in different ways. For example, the Inventory Turnover ratio is sometimes calculated as Sales/Inventory and sometimes as Cost of Goods Sold/Inventory. To make things more complicated, sometimes the inventory level used as the denominator is defined as (beginning inventory + ending inventory)/2 and other times analysts will simply use ending inventory. Some ratios also go by different names. The Quick Ratio is sometimes referred to as the Acid Test Ratio or the Days Sales Outstanding Ratio is sometimes referred to as the Average Collection Ratio. This can make ratio analysis quite confusing for people who are just getting introduced to the topic. For the purposes of this class, we are going to focus on the following ratios which will be referred to and calculated as follows (using ending values for balance sheet items).
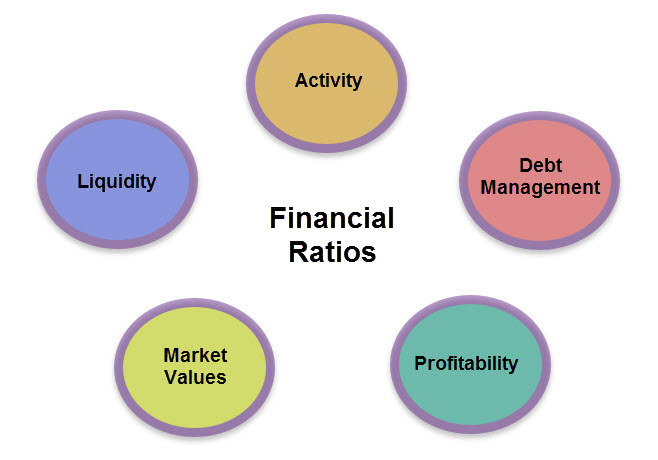
Liquidity Ratios
[latex]Current\ Ratio=\frac{Current\ Assets}{Current\ Liabilities}[/latex]
[latex]Quick\ Ratio=\frac{Current\ Assets\ -\ Inventory}{Current\ Liabilities}[/latex]
Activity Ratios
[latex]Inventory\ Turnover=\frac{Cost\ of\ Goods\ Sold}{Inventory}[/latex]
[latex]Days\ Sales\ Outstanding=\frac{Accounts\ Receivable}{Sales/365}[/latex]
[latex]Fixed\ Assets\ Turnover=\frac{Sales}{Net\ Property,\ Plant\ and\ Equipment}[/latex]
[latex]Total\ Assets\ Turnover=\frac{Sales}{Total\ Assets}[/latex]
Debt Management Ratios
[latex]Total\ Debt\ to\ Total\ Assets=\frac{Liabilities}{Assets}[/latex]
[latex]Total\ Debt\ to\ Equity=\frac{Liabilities}{Owners'\ Equity}[/latex]
[latex]Times\ Interest\ Earned=\frac{EBIT}{Interest}[/latex]
Profitability Ratios
[latex]Gross\ Profit\ Margin=\frac{(Sales\ -\ Cost\ of\ Goods\ Sold)}{Sales}[/latex]
[latex]Net\ Profit\ Margin=\frac{Net\ Income}{Sales}[/latex]
[latex]Return\ on\ Assets=\frac{Net\ Income}{Total\ Assets}[/latex]
[latex]Return\ on\ Equity=\frac{Net\ Income}{Owners'\ Equity}[/latex]
Market Values
[latex]Price/Earnings\ Ratio=\frac{Market\ Price\ per\ Share}{EPS}[/latex]
[latex]Market/Book\ Ratio=\frac{Market\ Price\ per\ Share}{Book\ Value\ per\ Share}[/latex]
[latex]Dividend\ Yield=\frac{Dividend\ per\ Share}{Market\ Price\ per\ Share}[/latex]
A couple of reminders. First, EPS refers to earnings per share and is simply (for the purposes of this class) net income divided by number of shares outstanding. Second, sales and revenues are used interchangeably in this class. Therefore, you can replace sales with revenues in any formula listed above. The goal of this class is not to make you an expert on ratio analysis, but to introduce it as a tool. This list of ratios will provide a strong foundation to build from if you delve further into ratio analysis.
One item that I want to stress is that interpreting ratios is as much of an art form as a science as there are always exceptions. Often, textbooks imply that once you calculate the ratios, you can easily identify a firm’s strengths and/or weaknesses and take advantage of them and/or fix them. This is an illusion. Calculating the ratios is relatively simple. Interpreting the ratios requires context, understanding, and often experience. You need to understand where the numbers are coming from and why they are what they are (corporate strategy, company downturn, economic downturn, seasonality, etc.) in order to really make meaningful analysis. Explanation of Ratios, in the Appendix B, focuses on explaining and interpreting each of these ratios. However, even if you can adequately interpret the ratios, they are diagnostic more than prescriptive. We will discuss some of the challenges in applying ratio (and other forms of financial statement) analysis in a little bit.
Common Size Statements
In addition to ratios, we can also glean information from financial statements by comparing them from year to year or from firm to firm. However, we need to be careful. If our sales go up from year to year, most likely so will our costs. What becomes important then is not did costs go up, but how did they change relative to sales. Alternatively, our inventory may be down, but if all of our other assets are down as well, we may be starting to carry too much inventory. Our selling and administrative expenses (or accounts receivable) may appear relatively low to our competitors. However, if their firm is three times the size of ours, these expenses or receivables may still be too high. To fix these problems, we can develop common size income statements and common size balance sheets. A common size income statement takes each category in the income statement and divides by sales (expressing the item as a percentage of sales). A common size balance sheet divides each component of the balance sheet by total assets (expressing each item as a percentage of assets). This makes it easier to compare items from year to year (or across different size firms) and see how well the company is doing in each component.
Trend Analysis
The ratios presented above are close to meaningless by themselves. Looking at a single ratio in isolation is about as useful as a physician trying to perform a diagnosis simply by looking at your temperature. It is a piece of the puzzle, but without context and additional information it is not very meaningful. Also, common size statements offer little value without context. In order for them to become valuable for analysis, we must have something to compare them to. One technique is to view how these ratios and common size statements change over time. For example, is our ROA rising or falling from year to year? If it is rising, that indicates we are doing a better job of generating profits from our assets. Alternatively, if our DSO ratio is rising, that indicates it is taking us longer to collect our credit sales. This may be a sign of a problem (note that I say “may” because it is also possible that we are intentionally offering more/better credit opportunities to customers in order to increase sales because our DSO was lower than optimal before). While we can do trend analysis with two years, it is better to have 3 to 5 years of ratios to analyze to truly spot trends. Too few years makes it hard to identify real trends as opposed to just normal year-to-year fluctuations. Alternatively, too many years may present a misleading picture as the company, industry, and economy has likely changed too much over the period to make comparisons meaningful. If you use quarterly data for trend analysis be careful of seasonality. It may not be appropriate to compare quarter two to quarter one, but instead only to quarter two of last year.
Potential Problems with Trend Analysis
One challenge with financial statement analysis is that many of the techniques we use help provide context for analysis, but they typically also have some flaws. Trend analysis is no different.
Seasonality
Due to seasonality in quarterly financial statements (and annual balance sheets), seasonality concerns may lead to distortions in trends. We must be aware of how seasonality can impact our ratios and common size statements before we can properly analyze trends.
Trend Changes
Trend analysis is designed to help us identify weaknesses and forecast future performance. The problem is trends can change suddenly. Often we can not identify changes in trends until after they have happened which can hinder our ability to use trends for predictions.
Fundamental Changes
Significant changes in firm strategy or industry dynamics may make comparisons to previous years less meaningful.
Comparative Analysis
Another way to make the ratios and common size statements meaningful is to compare them to industry averages or key competitors. For example, labor intensive industries may have high return on assets numbers while companies in capital (asset) intensive industries may have relatively low return on assets. Also, grocery stores are likely to have higher cost of goods sold values as a percentage of sales than software developers. If you are analyzing a software developer, it is important to compare it to others in the industry to determine if the numbers are “good” or “bad”. If our numbers compare favorably to the industry average that is a good sign, and numbers that compare unfavorably to the industry average indicate potential weaknesses. However, we must be careful here. Our goal is not to be average. If we are better than the industry average in an area, that does not mean we have no room for improvement and management should ignore that area.
Potential Problems with Comparative Analysis
Just like trend analysis, comparative analysis provides insights but also introduces some challenges. Some of these challenges are listed below.
Conglomerates
Some companies (such as Compass Minerals or Amazon.com) defy industry classification. Compass Minerals is both active in salt mining and plant nutrition which are two very different business lines. Amazon.com is a major retailer. However, they also offer streaming services, cloud computing, and are active in voice-related artificial intelligence. When a firm is involved in many different industries, comparative analysis can be misleading or extremely difficult to implement.
Concentrated Industry
Some companies (such as Facebook) dominate an industry to such a large extent that it can be misleading to compare them to the industry norm. It may also be hard to find a sample of direct, publicly-traded competitors to put together a good comparison.
Who Uses Financial Statement Analysis?
Who uses financial statement analysis? The answer is many different groups of individuals and institutions who are concerned with identifying the health and performance of a company. This includes, but is not limited to the following groups:
Company Management
Managers need to evaluate a variety of ratios in order to properly manage their firm. They need to understand the liquidity situation, how well the company is doing at generating sales from their assets, what the debt picture is telling them, how profitable they are, and how investors are valuing their stock. As such, they need the big picture view provided by all the ratios, an evaluation of the statement of cash flows and common size statements.
Competitors
Like management of our own company, management of our competitors are going to need a big picture overview of our firm (as well as their other competitors) to evaluate their own strengths and weaknesses relative to their competition.
Long-term Lenders
While current and potential bondholders (and other long-term lenders) are going to evaluate many areas covered by financial statement analysis, there are certain areas that are more important and others that are less critical. For example, a current/potential bondholder is not likely to care much about the firm’s PE ratio or inventory turnover ratio. On the other hand, debt management and liquidity ratios are going to be a big focus. Profitability ratios are somewhat in the middle. While long-term lenders prefer firms be profitable enough to have a margin of error in generating enough cash flows to meet their interest obligations and repay the principal, they are not really concerned with seeing profitability ratios be on the high end of the industry as they don’t benefit from excess profits like stockholders do.
Short-term Creditors
Like long-term lenders, short-term creditors are focused on the firm’s ability to repay its liabilities. However, they are less concerned with debt management ratios and more concerned with liquidity ratios. Whether the firm can meet their long-term obligations is less relevant as long as the firm can generate enough cash flows to meet their current obligations.
Stock Investors
Stock investors are going to have more of a big-picture focus than creditors. This is because the firm has to be generating sufficient cash flows, have significant and reliable profitability, meet its debt obligations (as stockholders come after bondholders in the priority of claims), and be able to purchase shares at a reasonable price.
Putting it All Together
One of the big challenges in financial statement analysis is that there are many factors that do not “follow the rules” and there are exceptions to everything. For example, a common rule of thumb for the liquidity ratios is that we want to see the current ratio at 2.0 or higher and the quick (acid test) ratio at 1.0 or higher. If these numbers are too low, it could be a sign that the firm is suffering liquidity issues and may have problems meeting its current liability obligations.  Now, consider Wal-Mart. As of the Jan 31st, 2021 Annual Balance Sheet, Wal-Mart had a current ratio of 0.97 and a quick ratio of 0.49 (see financial ratios table in Financial Statement from Walmart and Target, in Appendix B. At first glance, it would appear that Wal-Mart is on the verge of bankruptcy as they will not be able to pay their current liabilities. However, does anyone really believe Wal-Mart is in a financial crisis? I didn’t think so. Instead, they know that their inventory will turn over quickly and they have access to capital so they don’t need to hold much in current assets (beyond their inventory). This is a strategy that allows them to earn higher rates of return. Another firm with slower inventory turnover, less favorable relationships with suppliers, or less access to capital may be in severe problems with the same (or even slightly higher) ratios. Also, consider that when liquidity ratios are too high, that can also be considered a problem as it indicates firms are being inefficient in allocating their resources (long-term assets generally offer higher returns than current assets). However, Facebook has a current (and quick since they don’t have any inventory listed) ratio of over 5 at the end of their 2020 fiscal year. Does that imply that Facebook is not smart enough to properly allocate their capital or might there be other explanations for their high liquidity ratios? The key here is that it can be harder than it may seem to identify “good” or “bad” levels for ratios.
Another problem is identifying what a significant change is. For example, let’s say that our Return on Equity is 14.3% and the industry average is 14.5%. We are below the industry average, but only by a very small amount. Obviously we’d like it to be higher, but is this a weak spot or is it an average spot? How much below the industry average do we need to be before we get concerned? Let’s say that last year our Return on Equity was 14.0% and industry average last year was still 14.5%. Now we have increased our ROE (marginally), but it is still slightly below the industry average. Is it a strength (because it is improving), a weakness (because it is below the industry average), or neutral (because there was little change and we are close to the average). Again, how much different do the numbers need to be before we are concerned? These are judgment calls without clear answers.
Another issue is that while financial statement analysis might help us identify potential strengths and weaknesses, it doesn’t tell us what to do about them. For example, let’s say our net profit margin is rising and significantly higher than the industry average. This is good, but how does it help management? Can they ignore it and focus their attention elsewhere? If so, will it stay a strength? From an investor’s perspective, does this make us want to buy the stock? Maybe it’s a plus, but what if the stock price is high enough that it already captures this strength? Or is overvalued because of this? Ratio analysis should not be confused with stock valuation or an investment decision making tool, but instead a piece of the puzzle. Alternatively, what if our inventory turnover is significantly below the industry average and declining? We may know we have a problem, but we still have to figure out how to fix it. From an investor’s perspective, is this a reason to avoid the stock or is it offset by other strengths? Again, ratios will not tell us by themselves whether or not a stock is a good or poor investment.
Another item to remember is that when we go through our financial statement analysis, we are typically not identifying problems/strengths, but POTENTIAL problems/strengths. Think of the process as flagging areas for further investigation. When you visit a doctor, she checks your vital stats and asks you about symptoms. This is where the doctor generates an initial diagnosis, but then usually a series of tests are done to confirm what is wrong. Financial statement analysis is the initial diagnosis stage. Once you identify areas of concern, then you need to dig deeper to see what is going on and why. Once you have this additional information, then you can decide if it needs fixed and if so, how to proceed.
I’ll close with a comment that was raised earlier. In financial statement analysis, context is everything. We can’t look at a single ratio in isolation. A company may have a great inventory turnover ratio, but not be doing so profitably or be having problems meeting their debt obligations. A firm may be seeing profitability rise, but slower than the industry average. A company may have abnormally high or low ratios (or items in common size statements) relative to the industry, but be pursuing a different strategy than the industry. For example, one firm may have a higher inventory turnover with lower profit margin while another may have a lower inventory turnover with a higher profit margin. Both strategies may be successful and allow the firms to differentiate their target market. It does not mean one firm needs to increase their profit margin and the other needs to improve their inventory turnover. Because of the importance of context and other issues raised above, financial statement analysis is a useful, but very challenging, tool to apply.
Key Takeaways
The income statement, balance sheet and statement of cash flows provide significant information which management and analysts can use to diagnose potential strengths and weaknesses of the firm. While the statement of cash flows provides significant information in its original format, the data from the income statement and balance sheet can provide additional insights through the use of financial ratios and common size statements. Despite the ability of financial statement analysis to provide insights into the firm’s performance, it can be challenging to get the full benefits from this tool in a finance professional’s kit. The reason for this challenge is that context is essential to interpreting the results of such analysis and that even with the appropriate context, it can be difficult to correctly diagnose opportunities and problems. Context can be provided by trend and comparative analysis along with understanding the dynamics of the firm and its environment.
Exercises
Question 1
The income statement captures a company’s performance over time while the balance sheet captures its status at a point in time. What does this mean?
Question 2
A company has $100 million in total assets and $40 million in equity. How much does it have in total liabilities?
Question 3
How does depreciation create a difference between earnings and cash flows? Are there any other ways/reasons in which accounting earnings can be different from cash flows?
Question 4
What types of people use ratio analysis? Who might be most interested in liquidity ratios? asset management ratios? debt management ratios? profitability ratios? market value ratios?
Question 5
Company A has a ROA of 8% and a ROE of 12%. Company B has a ROA of 7% and an ROE of 15%. What does this tell us about the relative levels of debt financing between these two companies? Which company’s approach is better?
Question 6
Company A tends to have most of its sales in the fourth quarter and does a large percentage of sales on a credit basis. Company B also sells primarily on credit, but most of its sales come in the first and second quarter. An analyst looks at their DSO ratio from the annual balance sheet and income statement and notices that company A has a much higher DSO outstanding. The analyst concludes that Company A is doing a poor job of managing its accounts receivable. Is the analyst correct? Explain? Which company would likely have a higher inventory turnover ratio and why?
Question 7
Which statements are subject to seasonality?
A) Quarterly Income Statement
B) Annual Income Statement
C) Quarterly Balance Sheet
D) Annual Balance Sheet
Question 8
Company A has a Profit Margin of 3% while company B has a Profit Margin of 8%. This tells us that company B is outperforming company A. Is this statement true or false and explain your answer?
Question 9
What do we mean by trend analysis and comparative analysis? Why are these tools more useful than looking at the ratios for a single period in isolation?
Question 10
Identify at least one potential problem with trend analysis and one potential problem with comparative analysis.
Question 11
Why might a very low quick ratio be a cause for concern? How about a large quick ratio?
Question 12
From the perspective of management, what is the primary objective of financial statement analysis? What are some difficulties management might encounter in doing a complete financial statement analysis? Re-examine these two questions from the perspective of the stockholder.
Problem 1
Using the Financial Statements for Joe’s Gadgets in Appendix B, find the following ratios for both 2016 and 2017
1a. Current ratio
1b. Quick ratio (Acid Test)
1c. Inventory Turnover Ratio
1d. Days Sales Outstanding (Average Collection Period)
1e. Fixed Assets Turnover
1f. Total Assets Turnover
1g. Total Debt to Total Assets (Debt Ratio)
1h. Total Debt to Equity
1i. Times Interest Earned
1j. Gross Profit Margin
1k. Net Profit Margin
1l. Return on Assets
1m. Return on Equity
1n. Price Earnings Ratio
1o. Market-to-Book Ratio
1p. Dividend Yield
Problem 2
Using the Financial Statements for Joe’s Gadgets in Appendix B, prepare common size income statements and balance sheets for 2016 & 2017.
Problem 3
Use the following industry average ratios for 2017 and your answers to Problem 1 and Problem 2 to highlight any strengths and weaknesses for Joe’s Gadgets.
3a. Current ratio 1.75
3b. Quick ratio 1.00
3c. Inventory Turnover Ratio 4.75
3d. Days Sales Outstanding 50.0
3e. Fixed Assets Turnover 1.30
3f. Total Assets Turnover 0.50
3g. Total Debt to Total Assets 0.55
3h. Total Debt to Equity 1.22
3i. Times Interest Earned 3.25
3j. Gross Profit Margin 46.53%
3k. Net Profit Margin 4.88%
3l. Return on Assets 4.17%
3m. Return on Equity 12.02%
3n. Price Earnings Ratio 24.15
3o. Market-to-Book Ratio 3.98
3p. Dividend Yield 1.99%
Problem 4
Firm A reports a Profit Margin of 5% and a Total Asset Turnover Ratio of 1.5. Their total asset level is $6,000,000. Assume there are 600,000 shares outstanding and the PE ratio is 13. Also, assume the Return on Equity is 14%. Based on this, calculate the MV/BV ratio. Hint 1: Use (Net Income)/(Shares Outstanding) to get Earnings Per Share. Hint 2: Think of how you can use data provided and ratio formulas to fill in missing values to ultimately get the MV/BV ratio – it will take several steps.
Solutions to CH 2 Exercises
Student Resources
Explanation of Ratios in Appendix B
Financial Statements from Walmart and Target in Appendix B
Guided Tutorial for Financial Statement Analysis in Appendix B
Attributions
Image: Walmart by Mike Mozart is licensed under CC-BY 2.0
Image: Analyzing Financial Data by Dave Dugdale is licensed under CC-BY 2.0

.jpg)