6
Dr. Kevin Bracker, Dr. Fang Lin and Jennifer Pursley
Learning Objectives
After completing this chapter, students should be able to
- Diagram the financial system
- Discuss the components of the financial system and how they are connected
- Explain the role of the financial markets
- Explain the role of the financial intermediaries
- Differentiate between money and capital markets
- Differentiate between primary and secondary markets as well as explain the importance of each
- Explain the individual components that determine the rate of interest for a particular security
- Real Rate of Interest
- Inflation Premium
- Default Risk Premium
- Maturity Risk Premium
- Liquidity Risk Premium
- Special Characteristics Premium
- Explain the concept of a yield curve
- Explain the functions of the Federal Reserve System
Financial System
The financial system refers to the complex of markets and institutions which help move capital (or cash) from suppliers of capital to demanders of capital, see diagram.
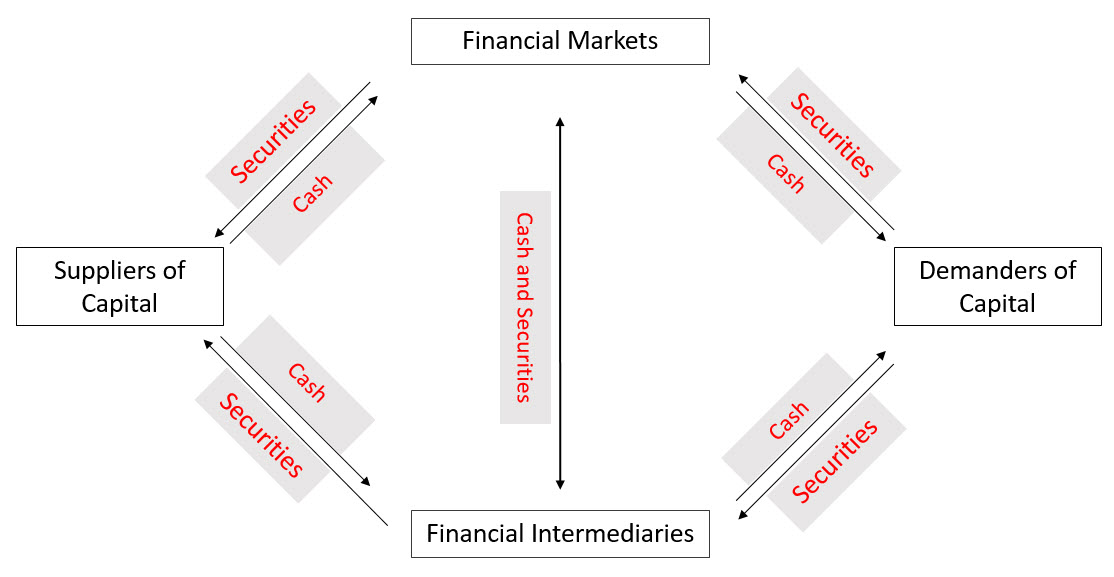
As you can see, capital (cash) flows from suppliers of capital to demanders of capital in several different routes. It can flow through the financial markets (for example, when an investor buys a stock or a bond) or through a financial intermediary (for example, when someone deposits their money in a savings/checking account at the bank). Securities flow from demanders of capital to suppliers of capital (in exchange for cash). For instance, in the example of an investor buying a stock or bond, the investor that is selling the stock is exchanging a security for capital through the financial markets. When you borrow money from the bank to purchase a new car you are exchanging a security (the loan agreement) for cash (to pay the car dealer). Capital and securities also flow both ways between financial intermediaries and financial markets (for instance, banks buy and sell Treasury bonds — sending capital to the financial markets in exchange for securities when buying and sending securities in exchange for capital when selling.
Components of the Financial System
Suppliers of Capital
Suppliers of Capital refer to those people/institutions that have extra income during the current time period that they are not using on current consumption. Instead of doing nothing with that extra income (or stuffing it in the mattress), they are going to put that extra money (referred to as capital) into the financial system so that they can earn a rate of return on their capital. Suppliers of capital can refer to individuals, businesses or governments. For example, when an individual is saving for retirement that person is acting as a supplier of capital (with the money that they are investing into their retirement fund.)
Demanders of Capital
Demanders of Capital refer to those people/institutions that need extra capital in order to meet their planned spending for the period. This could be
- An individual that is borrowing money for a new car
- A firm that is issuing bonds to expand production
- A firm that is issuing stock to expand production
- A local government issuing bonds to improve the area schools
- The federal government issuing bonds to finance government spending programs
- An individual selling off previous investments to fund their retirement
- Etc.
As you can see from the examples, demanders of capital include individuals, businesses, and governments. Also, it is important to note than many people will act as both suppliers of capital and demanders of capital during the same period. For instance, if I am saving $100 a month into a savings account to pay for a down payment on a house in a couple years and at the same time borrow money to buy a new car, I am both a supplier of capital in the first instance and a demander of capital in the second instance.
Financial Markets
Financial Markets help to bring together suppliers and demanders of capital in a more efficient manner if these suppliers and demanders of capital meet certain characteristics with respect to the financial securities that are being traded. Financial markets work most efficiently if the following characteristics are met:
- The number of identical (homogeneous) financial securities are large
- There are a large number of potential buyers (suppliers of capital) and sellers (demanders of capital) for a particular security.
Let’s explain this a little bit. Consider a security like IBM common stock. One share of IBM common stock is identical the next (this is referred to as being homogeneous) and there are over 900 Million shares outstanding (as of May 15, 2018). There are also a large number of potential buyers and sellers. In a situation like this, it doesn’t matter who we buy from or which shares we buy, so a financial market works well. Since we don’t have to investigate the particular seller or the specific shares they are selling, we can just place an order with a broker to buy 100 shares of IBM stock and they will buy them quickly in the marketplace.
Examples of financial markets may include
Stock Markets: NYSE (New York Stock Exchange) and NASDAQ (National Association of Securities Dealers Automated Quotations)
Bond Markets
Currency Markets
Derivative Markets
Financial Intermediaries
Financial Intermediaries (Institutions) act to process transactions between suppliers of capital and demanders of capital in which the financial markets are not efficient. For instance, if I as an individual want to borrow money for a new car, this is not an optimal transaction for a financial market. The number of identical financial securities (my car loan) is one. My personal credit and income characteristics are important, so the supplier of capital will not want to lend me money without investigating these issues. Also, these characteristics are different than the next person that wants to take out a car loan. Because of this, the marketplace approach that works well with stocks and bonds does not work well for transactions in which:
- The number of identical financial securities is small
- The personal characteristics of the buyer (supplier of capital) or the seller (demander of capital) are important to determining the value of the security.
- The supplier or demander of capital needs an additional service other than merely the transfer of cash ⇔ securities.
In these situations, financial intermediaries specialize in efficiently analyzing the information necessary to conduct transactions between suppliers and demanders of capital. In addition, they often issue a different security to the supplier of capital than was issued by the demander of capital. For instance, consider the car loan. The bank gets capital to make car loans from depositors. Depositors (suppliers of capital) put cash into the bank in exchange for checking accounts, savings accounts, and certificates of deposit. The bank pools this capital and lends it back out to the demanders of capital (the person taking out the car loan). By specializing in acquiring deposits, structuring different securities to meet the needs of suppliers of capital vs. demanders of capital, and in evaluating credit risks, the bank moves money from suppliers of capital to demanders of capital more efficiently than a marketplace would for these smaller, individualized transactions.
Examples of financial intermediaries may include
Credit Unions
Commercial Banks
Mutual Funds
Life Insurance Companies
Credit Card Companies
Key Market Distinctions
There are several different classification schemes which are applied to financial markets which are discussed below. It is important to note that these are merely classification schemes and do not represent specific, physical marketplaces. For instance, there is not a national “capital market” where all capital market securities trade. Instead the term “capital market” merely seeks to characterize a particular type of security. Also, specific securities may trade on multiple types of financial markets. For instance, IBM common stock is a capital market security that trades on the secondary market at an organized exchange (the NYSE). There are also additional market designations, but the ones listed below represent the principle classifications of market types.
Money Markets vs. Capital Markets
Money Markets include all markets in which securities with 1-year or less remaining until maturity trade. Two examples here would be Treasury Bills and Commercial Paper. Both of these are short-term debt securities issued by the federal government (T-Bills) or corporations (Commercial Paper). Another example of a money market security would be Repurchase Agreements.
Capital Markets include all markets in which securities with more than 1-year remaining until maturity. Some examples here would be stock markets, Treasury bond markets, and corporate bond markets.
Primary Markets vs. Secondary Markets
Primary Markets are markets in which the security is sold for the first time. The security changes hands from the corporation (or government) that issues the security to the investor that purchases the security. The issuing body receives the capital. An example here would be the IPO (Initial Public Offering) market in which a firm issues shares of stock for the first time. Another example may include the US Treasury issuing 5-year Treasury Notes. The US Treasury receives the capital from this transaction and the purchaser of the security gets the security. It should be noted that a security can only trade in the primary market one time. Any trade of the security after it is issued will take place in the secondary market.
Secondary Markets are markets in which the security is sold between investors. The firm that originally issued the stock or bond is not involved in the transaction and receives no money. The NYSE is an example of a secondary market. For example, consider the 5-year Treasury Note discussed above. When that security is issued, it is issued in the primary market. However let’s assume that, after holding it for one year, the original purchaser decides to sell the security. This transaction will take place in the secondary market. The secondary market accounts for the bulk of trading activity in the financial markets.
Primary markets are essential for raising money. Since this is where securities are issued, corporations and governments use the primary market to raise capital for their investments. Without a strong primary market, the ability of firms to raise money to pursue long-range business goals would be significantly damaged. Secondary markets are essential for providing liquidity and valuation information. Let’s first consider liquidity. Liquidity (as will be discussed later) refers to the ability to sell an asset quickly and for fair market value. Investors like liquidity. Without active secondary markets, there would not be any liquidity (if you purchased shares of stock issued by a corporation, you would have a hard time selling it later when you wanted to convert it into cash). Without liquidity, people would stop buying securities on the primary market (would you want to buy stock in a company if there was no active secondary market to sell it in later?). Therefore, secondary markets are necessary to keep primary markets viable. Another role of secondary markets is to provide valuation information. We can see the value of a particular stock by the price at which people are willing to buy/sell. Without an active secondary market, we would have much less information about the value of stocks and bonds.
More on Financial Markets
There are several different financial markets that exist in the United States (and several more that exist globally). Some financial markets trade stocks, others trade bonds, and still others trade different financial securities or assets (currencies, options, futures, etc.) Some of these markets have formal structures (such as the New York Stock Exchange or Nasdaq) while others are set up as a network of dealers (currencies and many bonds trade this way). In order to trade securities (stocks, bonds, derivatives), you need a broker. There are several different brokerage firms that offer a wide range of services. Some brokerage firms are referred to as full-service brokers that offer a complete range of trading services and financial advice. Typically these brokers also have the highest commission rates on trades. There are also electronic brokers (such as E*Trade or TD Ameritrade) which are structured for online trading. If you are interested in trading currencies or futures contracts, there are brokers that specialize in these types of securities. When you place your order with a broker, they then send that order to the financial markets where it is matched with someone taking the other side (for instance, if you are selling 100 shares of Wal-Mart someone else likely has an order with their broker to buy them).
Determinants of Interest Rates
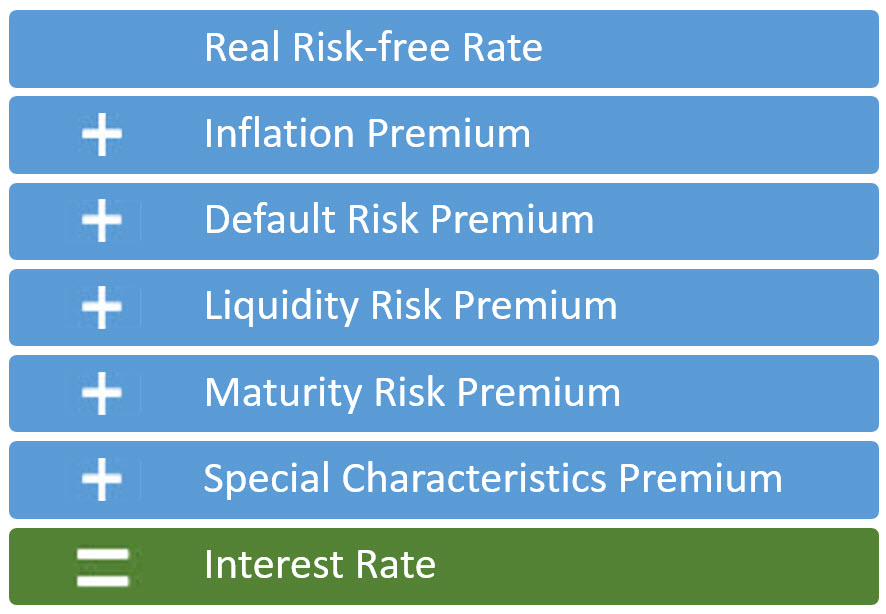
[latex]k=k^*+IP+DRP+LRP+MRP+SCP[/latex]
[latex]krf=k^*+IP[/latex]
where
k* = The real risk-free rate of interest
krf = The risk-free rate of interest
IP = The inflation premium
DRP = The default risk premium
LRP = The liquidity risk premium
MRP = The maturity risk premium
SCP = The special characteristics premium
Real Risk-Free Rate of Interest
The Real Risk-Free Rate of Interest should represent the amount of compensation that investors feel is necessary to forego consumption today and instead save/invest that capital. This is typically a small amount in the range of 1% to 3% per year. This is sometimes referred to as the “PURE RATE”. The pure rate (real risk-free rate) will fluctuate over time, but at any point in time should be approximately the same across all securities.
Inflation Premium
The Inflation Premium is a percentage above the real risk-free rate of interest that allows the investor/saver to compensate for any loss in purchasing power due to inflation. For example, if I were to earn a 5% rate of return on an investment and in the same time inflation was 10%, then I have really just lost 5% of my wealth. If I want to earn a real return of 3% when inflation is 10%, I need to get at least 13%. One other thing to keep in mind regarding the inflation premium is that it is based on the expected average annual rate of inflation over the length of the investment. For example, the 3-month Treasury Bill has an inflation premium based on the expected ANNUALIZED rate of inflation over the next 3-months, while the 30-year Treasury Bond has an inflation premium based on the expected AVERAGE ANNUAL inflation rate over the next 30-years. While 3 months is a relatively short time, in periods of rising prices, the expected ANNUALIZED can be quite high. Also, since we are looking at AVERAGE ANNUAL inflation not cumulative inflation, the inflation premium on longer term bonds can sometimes be relatively small. For securities with approximately the same time to maturity, the inflation premium should be the same across these securities.
Default Risk Premium
The Default Risk Premium compensates investors for the risk of a borrower defaulting on their loan. For Treasury securities this is usually estimated to be zero as the possibility of default by the US Treasury is nil. For Municipal Bonds and Corporate Bonds the default premium can be relatively small or large depending on the creditworthiness of the issuer. There is a strong relationship between default premiums and bond ratings. The weaker the bond rating, the higher the default risk premium.
Liquidity Risk Premium
The Liquidity Risk Premium compensates investors for the difficulty of turning their investments into cash on a timely basis for close to fair market value. The more liquid an asset is, the more valuable, other things being equal, it is to an investor. If investors are not able to quickly convert their investment to cash without selling the asset for a steep discount, they will demand compensation for tying up their capital. Treasury securities are very liquid. Corporate Bonds and Municipal Bonds are much less liquid and there is a lot of variance among the liquidity of various securities.
Maturity Risk Premium
The Maturity Risk Premium recognizes that longer-term securities are more risky than shorter-term securities. Remember from Chapter Four that long-term bonds fluctuate more in value when interest rates rise than short-term bonds. This makes them riskier. As investors are risk averse, they will demand a premium for investing in longer-term securities.
Special Characteristics Premium
The Special Characteristics Premium accounts for any special features that may be attractive or unattractive to investors. For example, the bond may be issued by an international firm and interest paid in a foreign currency. This introduces currency risk and may require a slightly higher rate in order to attract investors. There could be a call provision. As discussed in Chapter Four, a call provision limits the investors upside potential when interest rates go down, but doesn’t help the investor if interest rates increase. This “Heads I Don’t Win, Tails I lose” feature makes investors demand a higher premium to invest in callable bonds. Convertible Bonds typically carry a negative premium as it allows investors to participate in the gains from stock increases while providing the greater security of a bond. Any other special features can result in positive or negative special characteristic premiums depending on whether or not investors find the feature to be a bonus or a detriment.
Each security will have different interest rates based on the above factors. The real risk-free rate of interest should be similar across various securities, however the various other factors will fluctuate based on the issuer, time to maturity, and size of issue, etc.
Further Discussion of Interest Rate Determinants
Consider a Treasury Note with two years remaining to maturity vs. a 20-year, callable bond issued by a small firm with a BB bond-rating. The corporate bond should have a higher interest rate (bond yield) due to a larger maturity premium, larger default risk premium, larger liquidity premium, and larger special characteristics premium. The real rate of interest should be essentially the same on both bonds. The inflation premium will likely be different (as the expected annual rate of inflation over the next 2 years is likely to be different than that of the next 20 years), but it is not clear which bond will have the higher inflation premium as that depends on the particular economic environment and investors’ expectations regarding inflation over these two time periods.
Another thing to consider when discussing the differences in yields on these two bonds in terms of the various premiums is that the exact size of the various premiums is likely to fluctuate over time. For instance, in periods of economic turmoil, default risk premiums tend to increase (as corporate bankruptcies are more likely). In periods where interest rates are highly volatile, we might see maturity risk premiums increase as well. The premiums give us a framework for explaining why different bonds have different yields. Also, if we have enough bonds, we can estimate what the various premiums are in the current economic environment. However, we should keep in mind that in a real world environment, these premiums do fluctuate and are only ballpark estimates instead of exact values that we can look up and plug into the formula.
The Yield Curve
The Yield Curve refers to a graph of interest rates on securities with different times to maturity. The Yield Curve is designed to illustrate the difference between long-term and short-term interest rates. From our discussion above on determinants of interest rates, we know that the two factors that are likely to be different on bonds with different maturities are the maturity premium and the inflation premium. The longer the time to maturity, the greater the maturity premium will be. The inflation premium will depend on inflation expectations. The normal shape of the yield curve is upward sloping (due to the maturity premium). If we see a steep upward slope (more than a 1-2% yield difference between short-term and long-term bonds), that indicates that investors anticipate rising inflation (and, in turn, interest rates) in the future. If we see a flat or declining yield curve, that indicates that investors anticipate declining inflation (and interest rates) in the future. Since inflation typically slows in a recession, a downward sloping yield curve is an indicator of a potential recession. However, we must be careful. The economy is very complex and depends on hundreds of different influences. While a downward sloping yield curve is an indicator of a potential recession it does not mean there WILL be a recession – only that a recession is more likely than it would be if we had an upward sloping yield curve.
Another thing to stress on the yield curve is that things like the default risk and liquidity risk should be held as constant as possible along the yield curve. In other words, you would want to draw a yield curve entirely with Treasury bonds or entirely with BB-rated corporate bonds, but not with a mix of these bonds.
To view the current yield curve, see the following link:
Vanguard Funds Bond Yield Chart
The Federal Reserve System

The Federal Reserve System (the Fed) is the central bank of the United States. It was created in 1913, following a series of banking crises that led to the desire for some central control on the stability of the banking sector. Since then the Fed has evolved into one of the most powerful economic body in the world. Today the major goals of the Federal Reserve System include full employment, stable prices, and moderate long-term interest rates.
Functions of the Federal Reserve System
Managing the nation’s money supply through Conducting Monetary Policy is one of the primary responsibilities of the Fed. There are three main tools of monetary policy: open market operations, the discount rate, and the reserve requirements.
Open market operations is the most commonly used tool, in which the Fed purchases and sells U.S. government and federal agency securities, such as Treasury bills. As a recent example of using open market operations to implement expansionary monetary policy, the Federal Reserve purchased unprecedented amount of Treasury securities following the 2008 financial crisis to stimulate the U.S. economy. As a result, the Fed’s holdings of Treasury notes increased dramatically during the following years.
US Treasury securities held by the Federal Reserve
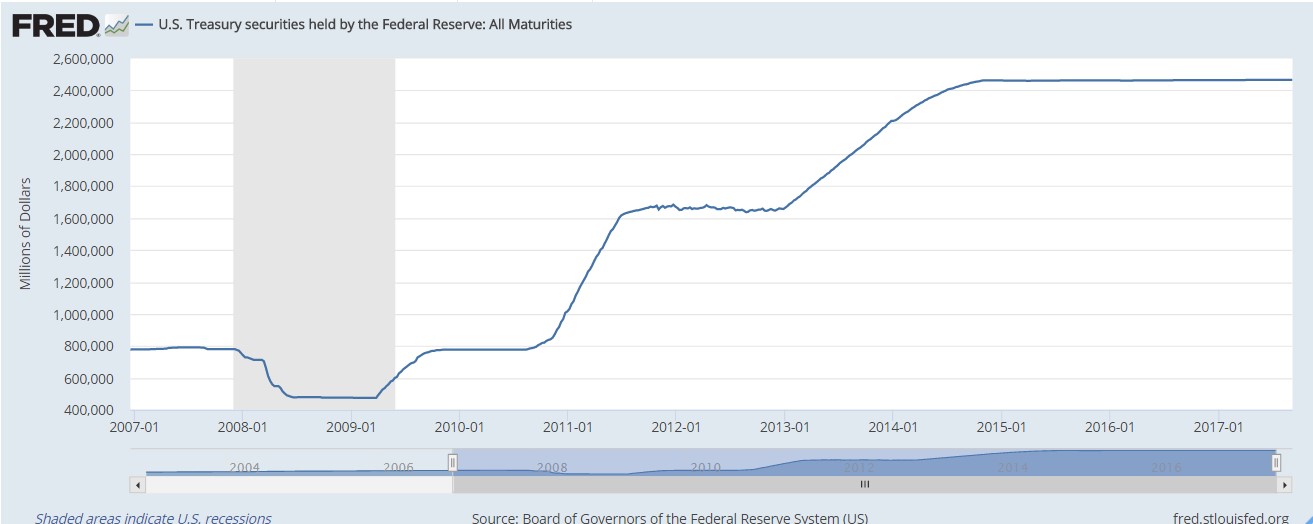
Source: https://fred.stlouisfed.org/series/TREAST
As an alternative approach to manage money supply, the Fed can simply change the discount rate it charges on the loans made to commercial banks. By lowering the discount rate, commercial banks would find the loans from the Fed more affordable and hence borrow more, which leads to an increase in money supply to the economy. A third alternative is to change the reserve requirement. Each commercial bank is required to hold some proportion of assets from being invested in such assets as loans and mortgages. When the Fed lowers the required reserve ratio, commercial banks free up additional capital which can be potentially made into loans and mortgages.
The Federal Reserve supervises and regulates the activities of banks and other financial institutions. To effectively implement its supervisory and regulatory function, the Federal Reserve System is divided into 12 districts. Each district has one main Federal Reserve Bank which examines the activities of member banks located in their own district. The figure below shows the geographic boundaries of the 12 districts.
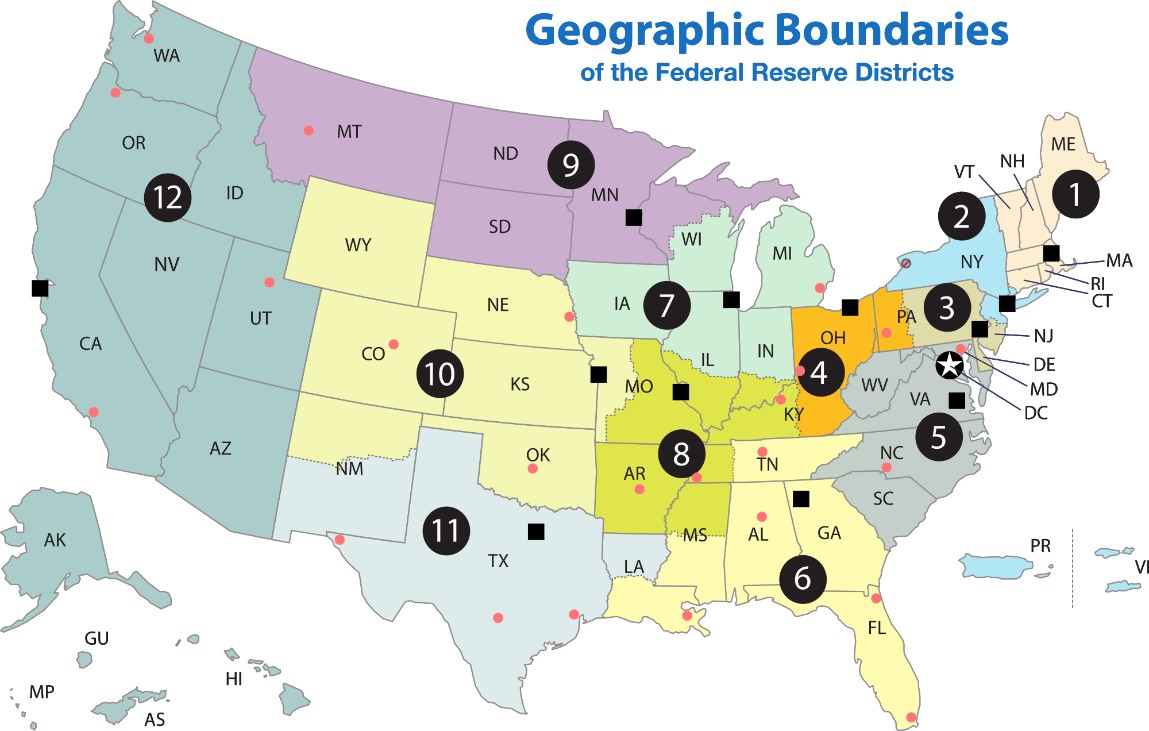
Source: https://en.wikipedia.org/wiki/Federal_Reserve_System
Other functions of the Federal Reserve include:
- Collecting and replacing damaged currency from circulation.
- Check clearing. The Fed transfers funds from one bank to another as checks clear through the system.
- Serving as the commercial bank for the U.S. Department of Treasury.
- Providing research in the banking sector and economy as a whole.
Key Takeaways
One of the fundamental components of a strong economy is a strong financial system. The financial system serves to bring together those that need to raise capital (demanders of capital) with those that have excess capital they would like to invest (suppliers of capital) in an efficient manner through either the financial markets or financial intermediaries. We can segment securities raised through financial markets and intermediaries as money market (short-term) vs. capital market (intermediate to long-term) securities. We can also segment activities as primary market transactions (where firms and governments raise capital) vs. secondary market transactions (where securities are traded amongst investors after they’ve been issued). The cost of raising capital is largely a function of a real rate of return to compensate investors for forgoing current consumption, an inflation premium to allow them to keep pace with anticipated inflation over the life of the security, and an assortment of risk premiums to compensate for the risk of their investments. One of the key actors in the financial system for the United States, as both a regulator and a participant, is the Federal Reserve. The Federal Reserve supervises and regulates the banking system, sets monetary policy for the United States, clears checks, and provides research in addition to other roles.
Exercises
Question 1
Diagram and fully label the financial system and the flows of capital (cash) and securities through the system.
Question 2
What is a “Supplier of Capital”? Give an example of where you or someone you know has been a supplier of capital within the past year.
Question 3
What is a “Demander of Capital”? Give an example of where you or someone you know has been a demander of capital within the past year.
Question 4
Is it possible to be both a supplier of capital and a demander of capital within the same time period? Explain.
Question 5
Explain how the financial system makes both suppliers of capital and demanders of capital better off.
Question 6
Explain why stocks are better suited for financial markets than financial intermediaries.
Question 7
Explain why auto loans are better suited for financial intermediaries than financial markets.
Question 8
Explain how the security that the demander of capital exchanges for capital with a financial intermediary can be different than the security received by the supplier of capital.
Question 9
Give an example of a transaction that goes from the supplier of capital to the financial intermediary to the financial markets to the demander of capital.
Question 10
Give an example of a money market security and a capital market security.
Question 11
Explain how a company can raise money in the financial markets through a primary market transaction.
Question 12
Explain how a company benefits from a secondary market transaction if it is not directly involved in the transaction.
Question 13
Given the following information, calculate the interest rate on each of the securities in parts 13a-13d.
- Current Real Risk-Free Rate of Interest ⇒ 2%
- Liquidity Premium on Treasury Bonds ⇒ 0%
- Liquidity Premium on Bond C ⇒ 0.1%
- Liquidity Premium on Bond D ⇒ 0.2%
- Average Annualized Inflation Rate Expected over
2 years ⇒ 3.0%
5 years ⇒ 3.5%
15 years ⇒ 2.5%
20 years ⇒ 2.5%
- Default Risk Premium
Treasury Bonds ⇒ 0.0%
AA Corporate Bonds ⇒ 0.3%
BB Corporate Bonds ⇒ 1.2%
- Special Characteristics Premiums
Call Provision 0.6%
Convertible Provision -0.8%
- Maturity Premiums
2 years ⇒ 0.0%
5 years ⇒ 0.15%
15 years ⇒ 0.5%
20 years ⇒ 0.6%
13a. 2-year Treasury Note (bond)
13b. 20-year Treasury Bond
13c. 5-year AA callable, corporate bond and
13d. 15-year BB convertible, corporate bond
Question 14
14a. Draw a yield curve based on the following bond yields:
3-Month Treasury Bill ⇒ 3.5%
1-Year Treasury Bill ⇒ 4.0%
2-Year Treasury Note ⇒ 4.2%
5-Year Treasury Note ⇒ 4.7%
10-Year Treasury Note ⇒ 5.0%
20-Year Treasury Bond ⇒ 5.1%
30-Year Treasury Bond ⇒ 5.2%
14b. Draw a yield curve based on the following bond yields:
3-Month Treasury Bill ⇒ 6.5%
1-Year Treasury Bill ⇒ 7.0%
2-Year Treasury Note ⇒ 7.0%
5-Year Treasury Note ⇒ 6.2%
10-Year Treasury Note ⇒ 6.0%
20-Year Treasury Bond ⇒ 5.7%
30-Year Treasury Bond ⇒ 5.7%
14c. Draw a yield curve based on the following bond yields:
3-Month BB-rated Corp. Bond ⇒ 8.0%
1-Year BB-rated Corp. Bond ⇒ 8.6%
2-Year BB-rated Corp. Bond ⇒ 8.7%
5-Year BB-rated Corp. Bond ⇒ 7.9%
10-Year BB-rated Corp. Bond ⇒ 7.6%
20-Year BB-rated Corp. Bond ⇒ 7.3%
30-Year BB-rated Corp. Bond ⇒ 7.4%
14d. What are the different yield curves in Exercise 14a and Exercise 14b telling us about inflation expectations in each situation?
14e. Assume that the yield curves in Exercise 14b and Exercise 14c both represent the same point in time. What information can we get about the differences in these two yield curves?
Solutions to CH 6 Exercises
Attributions
Image: New York Stock Exchange by vincent dejardins licensed under CC BY 2.0
Image: Federal Reserve Bank_San Francisco by Jerome Paz licensed under CC BY-NC 2.0
