8
Dr. Kevin Bracker, Dr. Fang Lin and Jennifer Pursley
Chapter Learning Objectives
After completing this chapter, students should be able to
- Identify what a capital budgeting project is, provide an example, and discuss why the capital budgeting process is essential to maximizing shareholder wealth
- Explain the difference between independent and mutually exclusive projects
- Identify and explain the relevance of the four key capital budgeting criteria
- Identify whether or not each of the criteria is met by each of the three decision techniques introduced in class (Payback Period, Internal Rate of Return, and Net Present Value)
- Calculate and conceptually explain the concepts of Payback Period (PP), Internal Rate of Return (IRR), and Net Present Value (NPV)
- Adjust for risk differences under PP, IRR, and NPV
- Evaluate independent and/or mutually exclusive projects using each of the three decision techniques in isolation and as a whole
- Explain the flaws and relevance of the PP
- Explain the flaws and relevance of the IRR
- Explain why NPV is the best model
- Explain the concepts of the size problem, reinvestment rate problem, and crossover problem as well as identifying when these problems might be present
- Explain the concept of the NPV profile
- Discuss the survey results of how these methods are applied in practice.
What is Capital Budgeting?
Capital budgeting is the process of deciding which long-term projects the firm should undertake.
Examples may include:
- The decision to purchase a new printing press.
- The decision to build a new warehouse.
- The decision to open or establish a second location on the other side of town.
- The decision to update an airline fleet.
Mutually Exclusive vs. Independent Projects
Mutually Exclusive Projects
Mutually exclusive projects are any set of projects in which choosing one makes the other projects no longer possible. For example, we are considering upgrading our printing press and have the choice of two alternatives. The first is a low-cost model that will need replaced in 3-years and the second is a more expensive model that will need replaced in 5-years. We can only choose one of these options, so they are mutually exclusive. When we have mutually exclusive projects, our decision rule needs to not only decide if a project is good or bad, but needs to be able to rank which project is the best.
Independent Projects
Independent (sometimes called stand-alone) projects are any set of projects in which choosing one has no impact on our decision to choose another project from that set. For example, McBurger Inc. may have the following capital budgeting projects to consider. The first is a new deep frying system for their french fries. The second is a new order placement system for the drive-thru. McBurger could choose to take the new deep fryer or the new order placement, or it could choose both. Taking one project does not influence the other, so they are independent. When we have independent projects, our decision rule does not need to rank which project is the best, but merely identify if the project is good or bad.
Many decisions made by the firm are neither independent nor mutually exclusive, but are instead interdependent. In this case, the decision to take one project impacts our decision to take another, but they are not mutually exclusive. For example, VideogamesPlus may decide to introduce a new video game machine along with some games for the new system. The two projects are not independent (the game machine will sell better with more games available) nor mutually exclusive (producing the games does not preclude producing the game machine). However, they are interdependent in that each project will perform better if both are produced. Some interdependent projects are compliments (like the example above) in which the cash flows from both projects taken together are greater than the cash flows from each project on a standalone basis. Other interdependent projects are substitutes in which the cash flows from both projects taken together are less than the cash flows from each project on a standalone basis. While we will not be evaluating interdependent projects in this class, the procedure is to look at each project individually as well as in combination.
Capital Budgeting Decision Criteria
Whatever capital budgeting decision rule we undertake should meet the following criteria:
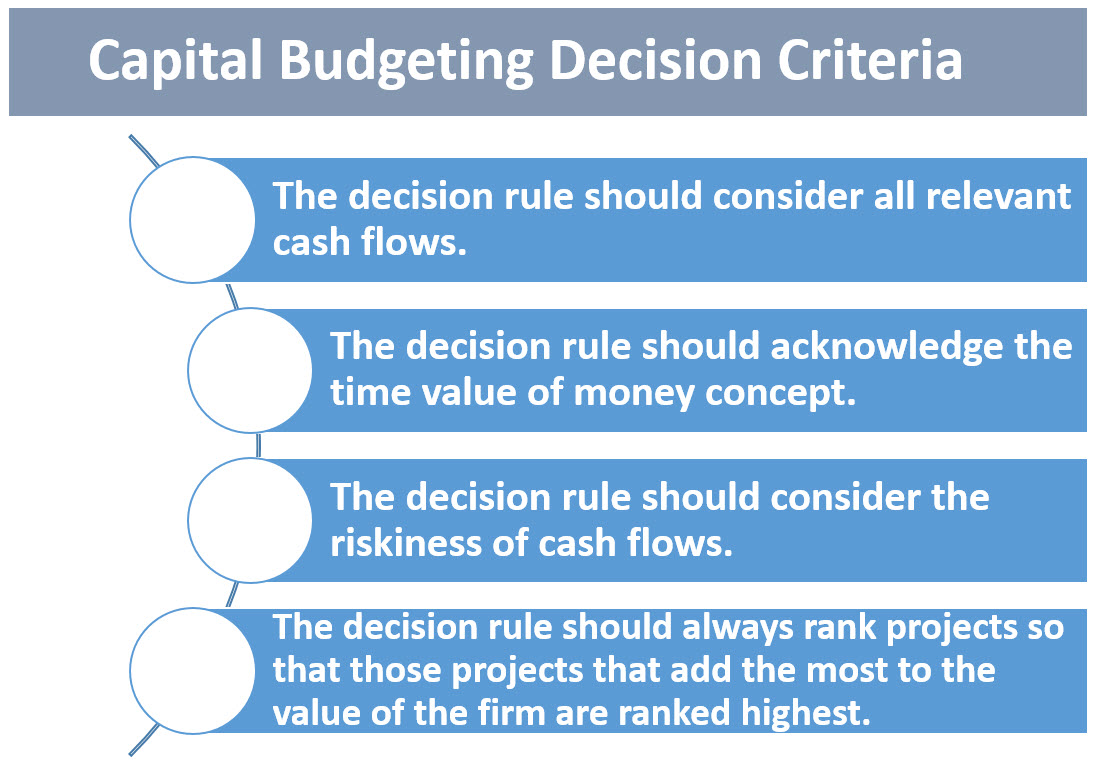
The decision rule should consider all relevant cash flows
Some decision rules (such as the Payback Period) stop considering cash flows after a certain cutoff point. This may result in us making a poor decision, especially when trying to choose between two or more mutually exclusive projects. We also should note that it is important to be careful about evaluating relevant cash flows. For instance, consider your decision to attend college as a capital budgeting decision. It is easy to underestimate the cost if you do not acknowledge that you could be earning income during the time you spend in class and on homework. This is an opportunity cost and is just as important as actual dollars spent.
The decision rule should acknowledge the time value of money concept
Since capital budgeting projects are long-term investments, the cash flows which they generate are likely to take place years into the future. If a firm spends $1000 today and receives back $100 per year over the next 10 years, they have not broken even. Instead, the project has caused a significant reduction in firm value. This is because the present value of $100 per year for 10 years is worth far less than the $1000 spent today.
The decision rule should consider the riskiness of cash flows
As we have discussed since chapter one, investors are risk averse. Therefore, the riskier the projects that the firm invests in, the higher the rate of return they must earn to satisfy stockholders. If we don’t adequately address risk in the capital budgeting process, we will find firms over investing in high risk projects and under investing in low risk projects.
The decision rule should always rank projects so that those projects that add the most to the value of the firm are ranked highest
This is something to be careful about. All decision rules will rank projects in some manner. However, if we are going to focus on maximizing shareholder wealth, then we want to rank projects based on how they add value to the firm. The more value the project generates, the more wealth is generated for our shareholders.
Capital Budgeting Process
It is reasonable to argue that capital budgeting is the most important factor in maximizing shareholder wealth. Good capital budgeting decisions can generate hundreds of millions (or even billions) of dollars for shareholders as often a successful project lays the foundation for many more on top of the original. Poor capital budgeting decisions can destroy wealth almost as quickly (especially if the firm does not recognize failure quickly enough and continues to throw good money after bad). While we will focus only on a small portion of the process (making the decision), it is worthwhile to look at the process as a whole.
Capital Budgeting Process
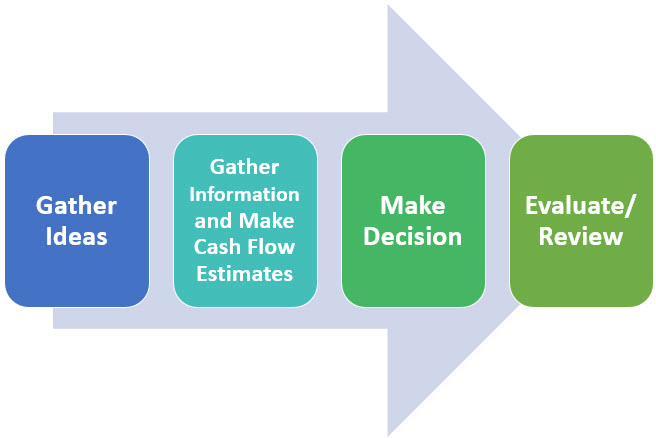
Generating ideas
The process starts by generating potential ideas for capital budgeting projects. These may be projects to improving existing processes within the firm (such as updating current manufacturing equipment or introducing new software to streamline our distribution) or it could be developing new product lines.
Gathering information and making cash flow estimates
A challenging and critical component to capital budgeting is the process of trying to forecast the relevant cash flows. This typically involves input from many areas of the firm (marketing may estimate sales levels and pricing of a new product, accounting may help with cost estimates, operations will discuss feasibility and labor demands, etc.). Here we must estimate how much it will cost us to initially purchase and implement new equipment, the life span of the project, the marginal revenue it will generate each year, the marginal costs associated with the project each year, etc. While there is a lot of subjectivity and forecasting involved here, the better we do at getting things right in this stage, the better our results will be. If this stage is done poorly, the rest of our analysis will not be very useful (garbage in, garbage out).
Make decision
This is where we focus our attention for this class. Given what we know about the cash flow estimates above, we evaluate whether or not the project will help us add value for shareholders. If yes, we pursue the project. If not, we reject it.
Evaluate/review
This is an important (and difficult) part of any decision-making process …evaluating the results. What makes this difficult is we need to avoid falling into the “Results Oriented Thinking” trap. For instance, consider a project that has a 25% chance of making $50 million and a 75% chance of losing $10 million. On average, we will make $5 million for taking the project (it is a good project). However, if we lose $10 million, does that mean we shouldn’t have invested? No! Taking the project is a good decision with a bad outcome. Unfortunately in practice this is harder to evaluate as it is hard to distinguish between bad forecasts and bad outcomes. Therefore, in evaluation we should evaluate the process for biases (do we tend to underestimate risk or overestimate projected revenues) instead of just focusing on the outcome itself.
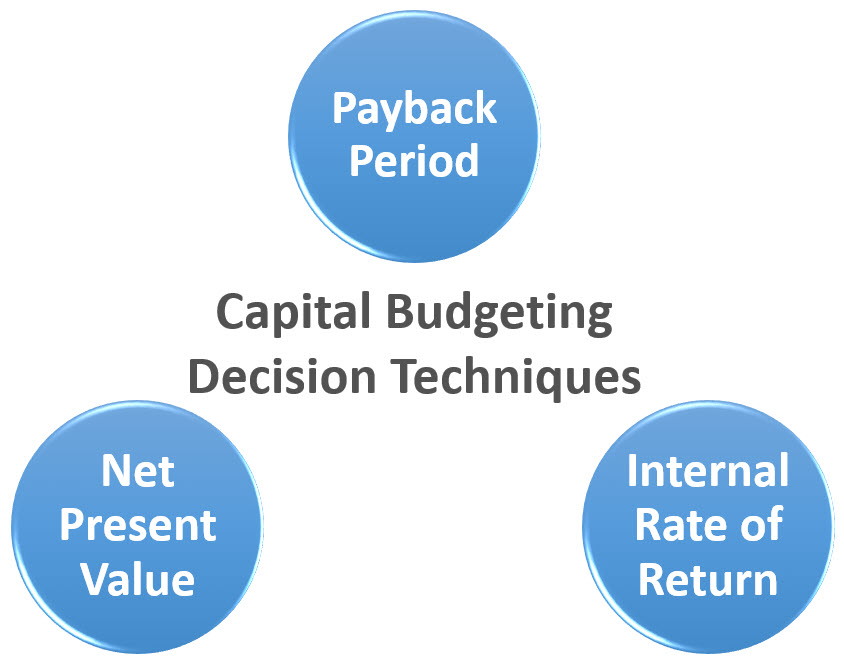
Capital Budgeting Decision Techniques
There are three capital budgeting techniques:
Note: There are many other additional capital budgeting decision techniques as well, but these are the primary models. Also, be careful about confusing concepts in this chapter as we have introduced (A) four key capital budgeting criteria, (B) a four-part capital budgeting process, and (C) three capital budgeting decision techniques. Oftentimes we will see students mix these up on tests or homework.
A capital budgeting criteria refers to a specific issue we would like the capital budgeting decision process to factor into the decision. For example, the decision rule should consider all relevant cash flows is a criteria.
A capital budgeting process is the set of procedures we want to follow throughout the analysis of a potential capital budgeting process. For example, generating ideas is part of the process.
A capital budgeting technique refers to the way we evaluate whether or not the capital budgeting project being evaluated should be accepted or not. For example, net present value is a technique.
Payback Period
The Payback Period measures the amount of time it would take to earn back the initial investment in the project. Management then decides how long they are willing to wait to recover their investment (critical acceptance level — T) and compares the calculated payback period to the critical acceptance level.
The decision rule for independent projects is to accept all projects that have a payback period less than the critical acceptance level (T). For mutually exclusive projects, the project with the lowest payback period would be chosen (assuming it is below the critical acceptance level)
For example, let’s assume that Jim’s Printing is considering the purchase of a new printing press. The press will cost $2000 to produce and will generate cash flows of $900 per year for 3 years. What is the payback period for this press? If Jim’s assigns a critical acceptance level of 2.0 years, should they accept the project?
- In year one, we earn back $900 and have $1100 of our initial investment to recover
- In year two, we earn back another $900 and still have $200 of our initial investment to recover
- In year three, we will earn more than our initial investment and therefore we know that the payback period is more than two years, but less than three years
- Since we will pay off our initial investment between the 2nd and 3rd year, we divide the amount remaining to be paid off at the start of the 3rd year ($200) by what we will receive in the 3rd year ($900) and find out that it will take us two full years plus 2/9ths (0.22) of the 3rd year to recover our initial investment.
- Therefore, our payback period is 2 + 0.22 years (2.22 years).
Since the Payback Period = 2.22 years which is greater than 2.0 years (our T), we should reject the project.
How well does the payback period meet our 4 criteria? Very poorly. It ignores the time value of money and it may not consider all relevant cash flows (ignoring all cash flows that are after the payback period). Also, the decision rule is arbitrary – what is an acceptable payback period? It also ranks by time instead of shareholder wealth. Because of these flaws, the payback period does not always pick the best project. Despite this, many corporations still calculate the payback period (although usually not as the primary decision tool). Does this mean corporations are stupid? Probably not. What are some situations that you can think of in which the payback period may provide critical information in making a capital budgeting decision? Think about this for a minute before reading further.
There are two primary situations when payback period can be helpful. The first is when the distant cash flows are highly uncertain. For instance, we may project a 6-year life span for the project and find out after two years that the technology behind it has become obsolete and the project must end prematurely. In a situation like this, it would be extremely helpful to have had the entire project paid back by the end of the second year. That way even if we didn’t make as much as planned, we at least recovered our investment. The second situation where Payback Period is extremely helpful is when our firm is facing significant financial problems. Consider a highly profitable long-term investment that has very low cash flows in the first couple years and high cash flows in the later years. Can we afford to undertake such an investment if we are having financial problems? Probably not, there is too much of a chance that we will end up bankrupt and out of business before we can get to the part of the project with the high cash flows. For firms suffering from financial distress, projects having a quick payback are important.
Video Capital Budgeting Part One -Introduction and Payback Period
Internal Rate of Return
The Internal Rate of Return calculates the average annualized rate of return that we can earn over the lifetime of the project.
The acceptance rule for independent projects is to accept all projects where the IRR is above the required return (hurdle rate) for those projects. If projects are mutually exclusive, accept the one with the highest IRR (assuming it is above the hurdle rate).
Let’s look at the IRR of our printing press example
CLEAR WORKSHEET
CF0 = -2000
CF1 = 900
CF2 = 900
CF3 = 900
SOLVE FOR IRR AND GET 16.65%
This is the process we used in Chapter Three Time Value of Money to find the discount rate. Here is a quick review for each calculator:
Calculator Steps to Compute IRR
| HP10BII+ | TI-BAII+ | TI-83/84 |
| Step 1: SHIFT C ALL Step 2: -2000 CFj Step 3: 900 CFj Step 4: 3 SHIFT Nj Step 5: SHIFT IRR/YR |
Step 1: CF 2nd CLR Work Step 2: -2000 Enter ↓ Step 3: 900 Enter ↓ Step 4: 3 Enter Step 5: IRR Step 6: CPT |
Go to APPS⇒Finance⇒ Step 1: Select irr( Step 2: Enter the given information in the following format: irr(CF0,{CF Stream},{CF Frequencies} irr(-2000,{900,900, 900},{1,1,1} Step 3: ALPHA SOLVE |
Should we accept the project? Let’s assume that the project had a required return of 10%. Given this information, we would accept the project because the IRR is greater than the required return (or hurdle rate). This means that we are earning more than we need to compensate us for the risk we are assuming when we undertake the project.
How well does the IRR meet our 4 criteria? Very well if projects are independent. If projects are mutually exclusive, not so well. IRR incorporates the time value of money and considers all relevant cash flows. We can adjust for risk by adjusting our hurdle rate (the minimum acceptable rate of return for the project). If projects are independent (and there is no crossover problem – see below), the IRR will always make the right decision. However when projects are mutually exclusive, it will not always rank the projects correctly (again, see below). Despite this flaw, is used quite frequently as a capital budgeting techniques (although few firms use it in isolation).
Video Capital Budgeting Part Two -Calculating Internal Rate of Return
Crossover (Multiple IRR) Problem
If cash flows for a project crossover more than once (go from negative in one period to positive in the next or vice-versa) then the IRR will have more than one mathematically valid solution. For projects with a crossover problem, the IRR cannot be used. For instance, consider a project with the following cash flow stream:
CF0 = -$100
CF1 = $180
CF2 = $0
CF3 = $0
CF4 = $0
CF5 = $0
CF6 = $0
CF7 = -$100
The project has two IRR’s (4.9% and 76.7%). With two solutions, it is unclear whether to accept or reject the project, so we use NPV analysis instead. IRR is unreliable in this situation.
Size Problem and Reinvestment Rate Problem
If projects are mutually exclusive, the IRR can provide invalid rankings due to two problems. First, if the projects are of different sizes (the size problem). Second, if the timing of cash flows is vastly different (one project has cash flows come in evenly throughout the payback period and the other generates low cash flows early on and high cash flows near the end – or other such differences). This is referred to as the reinvestment rate problem. I will explain each of these in detail below, however, it is important to note that these two problems are only relevant when dealing with mutually exclusive projects. If we are dealing with independent projects, they may still impact the rankings but they will not cause us to make an incorrect accept/reject decision.
Size Problem
The issue with the size problem is related to IRR’s focus on rate of return instead of value generation in terms of dollars. Consider a situation where you had the choice of two projects. Project A cost $1 today and would return $2 at the end of 1 year. Project B cost $1000 and will return $1500 at the end of 1 year. The first project has a 100% IRR while the second project only has a 50% IRR. At first glance, it appears that Project A is twice as good. However, if you could only take one of these two projects, which would be better? Clearly Project B is a better choice in that you will make $500 beyond your initial investment. If you took Project A, while you earned a higher return you would only make enough profit to visit the $1 menu at your local fast-food chain. When we can only choose one of the available projects, it is not important to identify which project generates the highest rate of return, but instead which project generates the most value. A high rate of return on a small investment is not likely to be as valuable as a moderate rate of return on a large investment. We can recognize the potential for a size problem in evaluating capital budgeting projects by looking at the initial investment. If initial investment sizes are very close, we likely will not encounter a size problem. If initial investments are vastly different, we need to be aware of the size problem and use NPV if dealing with mutually exclusive projects.
Reinvestment Rate Problem
The reinvestment rate problem is not as intuitive as the size problem. The reinvestment rate problem is a function of the process by which the IRR is generated mathematically. In order to calculate the IRR, the calculator assumes that all cash flows received throughout the projects life will be reinvested at the IRR. For instance, let’s assume that you have the following project
CF0 = -$1000
CF1 = $800
CF2 = $400
CF3 = $300
This gives us an IRR of 29.02% (in other words, we are expecting to earn an average rate of return of 29.02% per year over the next three years on our $1000 investment that we are making today). However, in order for this IRR to be realized, we will need to take the $800 that is generated at the end of year one and reinvest it somewhere for the remaining two years at 29.02%. Is this realistic? Well, how many investments do you know that pay nearly 30% rates of return? Probably not too many. As such, our average return is biased upwards (as we will likely earn much less than the 29% needed on reinvested cash flows). This bias will be greater for projects that are front loaded. The term front loaded refers to projects with higher cash flows early in the project life. The bias is greater here because the faulty reinvestment rate assumption has longer to impact our final answer. The bias is smaller for projects that are back loaded (cash flows coming in primarily later in the project life). Because of this difference in bias, front loaded projects are likely to have an artificially higher IRR than back loaded projects, which can potentially cause us to rank them incorrectly. If we are evaluating mutually exclusive projects with different timing (front loaded vs. back loaded), then we should be careful of the reinvestment rate problem and choose NPV as our decision tool.
Two last comments on the reinvestment rate problem. First, as with the size problem, it is only important when evaluating mutually exclusive projects. It will not distort accept/reject decisions for independent projects. Second, there is a process called Modified Internal Rate of Return (MIRR) that can be used to correct this issue. However, it is beyond the scope of this class and we will not be covering it.
Net Present Value
The Net Present Value measures the value added by investing in the project. Specifically, the NPV is equal to the present value of all cash flows less the initial investment.
The decision rule for independent projects is to accept all projects with a positive NPV. For mutually exclusive projects, accept the project with the highest positive NPV.
Let’s consider the printing press example above, what is its NPV (assume the required return on the project is 10%, just like when we did the IRR analysis)?
CLEAR WORKSHEET
CF0 = -2000
CF1 = 900
CF2 = 900
CF3 = 900
I/YR = 10
SOLVE FOR NPV AND GET $238.17
Calculator Steps to Compute NPV
| HP10BII+ | TI-BAII+ | TI-83/84 |
| Step 1: SHIFT C ALL Step 2: -2000 CFj Step 3: 900 CFj Step 4: 3 SHIFT Nj Step 5: 10 I/YR Step 6: SHIFT NPV |
Step 1: CF 2nd CLR Work Step 2: -2000 Enter ↓ Step 3: 900 Enter ↓ Step 4: 3 Enter Step 5: NPV 10 Enter ↓ Step 6: CPT |
Go to APPS⇒Finance⇒ Step 1: Select npv( Step 2: Enter the given information in the following format: npv(Rate,CF0,{CF Stream},{CF Frequencies} npv(10,-2000,{900,900, 900},{1,1,1} Step 3: ALPHA SOLVE |
Video Capital Budgeting Part Three -Calculating Net Present Value
How well does the NPV meet our 4 criteria? Perfectly. The NPV directly addresses the time value of money. It also considers all relevant cash flows. The riskiness of cash flows can be acknowledged by using a higher discount rate for high-risk projects and a lower discount rate for low-risk projects. The decision rule for NPV will always provide the correct decision. NPV is used by almost all firms as a key capital budgeting decision tool.
When evaluating projects always use NPV as the decision maker. Even if PP and IRR conflict with your NPV analysis, go with the project with the highest NPV.
Video Capital Budgeting Part Four -Analysis of Decision
NPV Profile
| Required Rate of Return | NPV |
| 0% | $700.00 |
| 5% | $450.92 |
| 10% | $238.17 |
| 15% | $54.90 |
| 20% | ($104.17) |
| 25% | ($243.20) |
NPV profile is a graph that shows the relationship between a project’s NPV and the required return on the project. To draw the NPV profile, we first need the project’s NPV at a number of different discount rates. Let’s stick with the example above, which requires an initial investment of $2,000 and generates $900 per year for the next three years. Instead of using a single required rate of return of 10%, I allow the rate to change within a range, say from 0% to 25%. For each discount rate, I would record the corresponding NPV value. The table to the right shows some of the results.
Next, we plot these values to create the NPV profile. Make sure to plot discount rates on the x-axis and NPV on the y-axis. For the project in this example, NPV declines as discount rate increases.
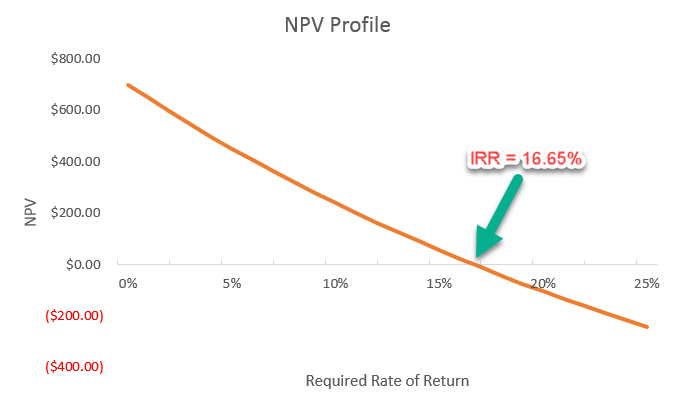
One unique feature about the NPV profile is that it visualizes how IRR is related to NPV. Recall that the IRR of this project is 16.65%, and that is the exact discount rate at which the profile line crosses the horizontal axis. In other words, IRR is in fact the discount rate that makes the project NPV to equal zero.
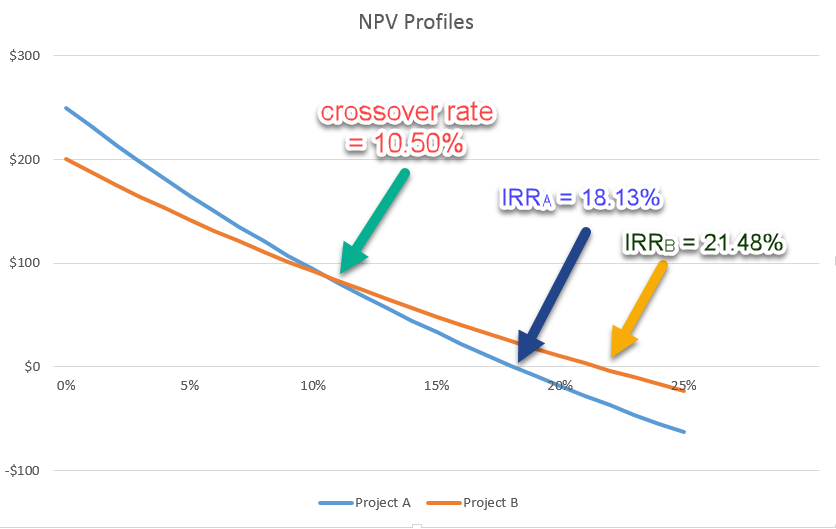
Now consider two mutually exclusive projects. Project A and Project B require the same initial investment at time 0, but their cash flows in the following years differ.
| Year | Project A | Project B | Incremental Cash Flow ΔCF = CFA – CFB |
| 0 | -$500 | -$500 | $0 |
| 1 | $50 | $300 | -$250 |
| 2 | $300 | $250 | $50 |
| 3 | $400 | $150 | $250 |
The figure below shows two NPV profiles – one for A and one for B – and the following are worth noting:
When the discount rate increases, the NPVs from both projects decline.
Each project has only one fixed IRR. The IRR of Project A is lower than that of Project B, no matter what the discount rate is.
The two profiles crosses at a discount rate of 10.50%, which is considered as the crossover rate of the two projects. When the actual cost of capital is lower than the crossover rate, Project A should be taken because it has a higher NPV; when the actual cost of capital exceeds the crossover rate and as long as the NPV is positive, Project B should be accepted.
To find the crossover rate, I first need to compute the incremental cash flows as the difference in the two projects cash flows (see the last column of the table above), and then calculate the IRR based on the incremental cash flows.
Capital Budgeting in Practice
While the data is starting to get dated, the most recent survey of capital budgeting techniques used in practice was conducted in 1999 and published in 2002 (Ryan and Ryan, 2002). This survey was based on Fortune 1000 firms and received 205 usable responses. Key findings include:
- 85.1% of respondents use NPV either always or often
- 76.8% of respondents use IRR either always or often
- 52.6% of respondents use PP either always or often
This tells us that not only is NPV the preferred choice from a theoretical perspective, it is also the preferred choice of firms in practice. However, equally important is the concept that many firms rely on multiple techniques rather than merely choosing one when evaluating capital budgeting decisions. Even though there are flaws with IRR and PP (which have been discussed above), they are still used in practice. Possible reasons for this include that the marginal cost of performing the additional calculations is small and there may be reasons where the benefits of communicating the results or factoring in the concerns of financial distress possibilities make it worthwhile to include IRR and PP in the analysis, even if they are not a primary decision tool.
Key Takeaways
Capital budgeting refers to the practice of evaluating long-term investments that firms undertake, such as building a new warehouse, opening a new production facility, developing a new product, or replacing existing equipment. Since the firm is really just a collection of all its past and future capital budgeting projects, this is one of the key components associated with maximizing shareholder wealth. Capital budgeting projects can be thought of as independent projects (where we want to accept all good projects) or mutually exclusive projects (where we can only take one from the set so must choose the best project). When evaluating capital budgeting projects, we need to make sure that we consider all the relevant cash flows the project is expected to generate, acknowledge time value of money, control for the riskiness of the expected cash flows and choose the project that adds the most to firm value. While there are many different techniques for evaluating capital budgeting projects, the three most common are Payback Period, Internal Rate of Return, and Net Present Value. Of these three methods, all are used in practice by a significant percentage of firms. However, only NPV (which is used most frequently) meets all four of the criteria we designate as critical in choosing projects. Therefore, when making decisions, NPV should be our primary decision tool.
Exercises
Question 1
What are the four capital budgeting decision criteria?
Question 2
Identify 4 flaws of the payback period? Given these flaws, why should you know the payback period method?
Question 3
With independent projects that do not suffer from the crossover (multiple IRR) problem, will the IRR and NPV always give the same accept reject decision? Explain.
Question 4
What are 3 potential problems with the IRR? Given these flaws, why should you know the IRR method?
Question 5
How can we account for risk under each of the three methods (PP, IRR, NPV)?
Question 6
Consider a situation where a firm carefully performs capital budgeting analysis and selects a project with a high, positive NPV. Three years later, the project is terminated early and the company has lost significant money on the project. Does this mean that their capital budgeting process is flawed? Explain.
Problem 1
Calculate the PP, NPV, and IRR of the following projects (assuming a 14% required return and critical acceptance level <T> of 3 years)
| Cash Flow | Project A | Project B | Project C | Project D |
| CF0 | -$1,000,000 | -$1,000,000 | -$500,000 | -$500,000 |
| CF1 | 400,000 | 150,000 | 200,000 | 75,000 |
| CF2 | 400,000 | 100,000 | 250,000 | 50,000 |
| CF3 | 225,000 | 550,000 | 150,000 | 225,000 |
| CF4 | 200,000 | 775,000 | 100,000 | 387,500 |
Which project(s) should we accept if they are independent? Mutually Exclusive?
Problem 2
In the problem above, identify a pair of projects that could suffer from the size problem, but not a reinvestment rate problem. Next, identify a pair of projects that could suffer from the reinvestment rate problem, but not the size problem.
Solutions to CH 8 Exercises
Videos
Capital Budgeting Part One -Introduction and Payback Period
Capital Budgeting Part Two-Calculating Internal Rate of Return
Capital Budgeting Part Three -Calculating Net Present Value
Capital Budgeting Part Four -Analysis of Decision
References
Ryan, P. A., & Ryan, G. P. (2002). Capital budgeting practices of the fortune 1000: How have things changed? Journal of Business and Management, 8(4), 355-364.
