Additional Content
Machine Learning and AI Through Data Experiments in Orange
Blaž Zupan
Are dolphins mammals, and if so, why?
What species of animal is a kiwi?
Are Athens and Rome in the same weather zones?
Who painted a famous painting with a screaming lady? Does this artist always paint the sky in orange?
Can we guess the author of a post on social media only from the style of writing?
In style of playing, does Luka Dončič have a clone in the NBA?
Can the species of the tree be guessed from its leaves? Or from a photo of its bark?
How do world countries group by their socioeconomic features? Is the world indeed socio-economically divided to north and south?
Are Rome and Athens in the same weather zone? According to the weather patterns, which country’s capital is most similar to Berlin?
Data science, particularly machine-learning methods, serves as catalysts for change across various fields such as science, engineering and technology, significantly impacting our daily lives. Computational techniques capable of sifting through extensive data sets, identifying intriguing patterns and constructing predictive models, are becoming omnipresent. However, only a few professionals possess a fundamental understanding of data science, with even fewer actively involved in building models from their data. In an age where AI quietly moulds our world, everyone must be aware of its capabilities, advantages and potential risks. We must establish methods to effectively communicate and teach concepts related to data science to a broad audience. The principles and techniques of machine learning, data science and artificial intelligence should become common knowledge.
Every question posed at the start of this chapter can be answered by observing relevant data. We propose the following approach to training machine-learning, Start with the question, find relevant data and then answer the question by means of finding relevant data patterns and models. In project Pumice, we are developing educational activities that can be used to enrich different school subjects. We use data related to the subject matter and explore it using AI and machine-learning approaches. In partnership with educators, we have developed learning templates and background explanations for teachers and students.
Pumice’s activities and training are supported by Orange, a machine-learning program that features an intuitive interface, interactive visualisations and visual programming. The key to simplicity is a Lego brick-like construction of analytical pipelines and interactivity of all the components (see Fig. 1). This is required in the training and versatility to cover most of the core topics and adapt to various application areas. To further support the teaching and to focus on concepts rather than on underlying mechanics, Orange implements easy access to data, reproducibility through the saving of workflows with all the various user-based settings and choices, and easy customisation through the design of new components. A critical aspect of the training involves storytelling through workflow inspection and specialised features for experimentation, such as drawing the experimental data sets or learning about the over-fitting of polynomial linear regression. Orange is available as open-source software and is complemented by a concise training video.
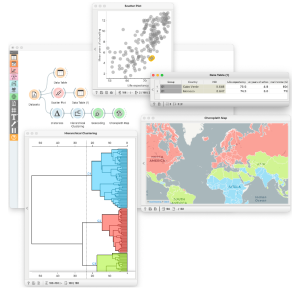
Fig. 1. Orange data mining software and a typical data exploration workflow.
In Fig. 1 we show a typical Orange data-exploration workflow. The workflow consists of components that load the data, compute the distances, visualise the data or resulting models, or perform any task necessary to find and visualise data patterns. In this workflow, we have used the socioeconomic data from world countries. The upper branch of the workflow studies two features and shows that life expectancy and years spent in school are correlated. It also shows that there are countries such as Cabo Verde and Morocco where people live long but do not spend too much time in school. Children in schools can design such networks to explore which countries are socio-economically similar to each other and where they can find that the world is socio-economically split into north, central, and south and that there is a great divide between developed and underdeveloped parts of the world. There is no need to tell them this explicitly – with mining the data in Orange, they will do so regardless and, in the upper classes, dive into these divisions on their own.
The development of Orange began in 2003. Since then, it has gained substantial traction. With over 50,000 distinct monthly users, Orange has established itself as a widely embraced specialised software application. Approximately half of its users hail from the academic sphere. Notably, Orange has experienced a notable upswing in adoption within the education sector, with over 500 universities across the globe incorporating it into their data-science courses.
If you’re an educator keen on delving into the realms of machine learning and data science, here’s a compilation of resources that provide an introduction to these disciplines through hands-on data exploration using Orange:
- Orange, the toolbox’s website
- An introduction to data science, is a set of short videos that showcase selected visualization and machine learning methods with Orange. Find videos on http://youtube.com/orangedatamining, and go to the “Intro to Data Science” playlist.
- Pumice is a teacher website where we gather use cases that you can incorporate into your training program.
