Temperatures at different airports
Representing temperatures at different airports as a vector
We record the temperatures at three different airports and obtain the following table. 
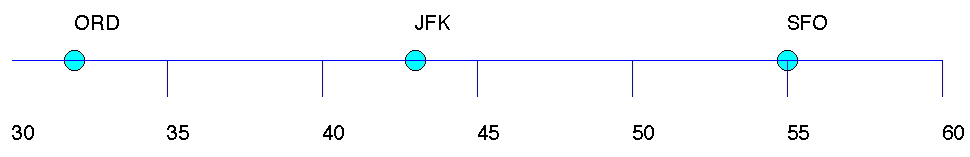 |
We can represent the temperatures on a single temperature axis. This is known as the dot representation of a vector. |
 The dot representation could become very confusing if there were three temperatures to plot for each day in the year.
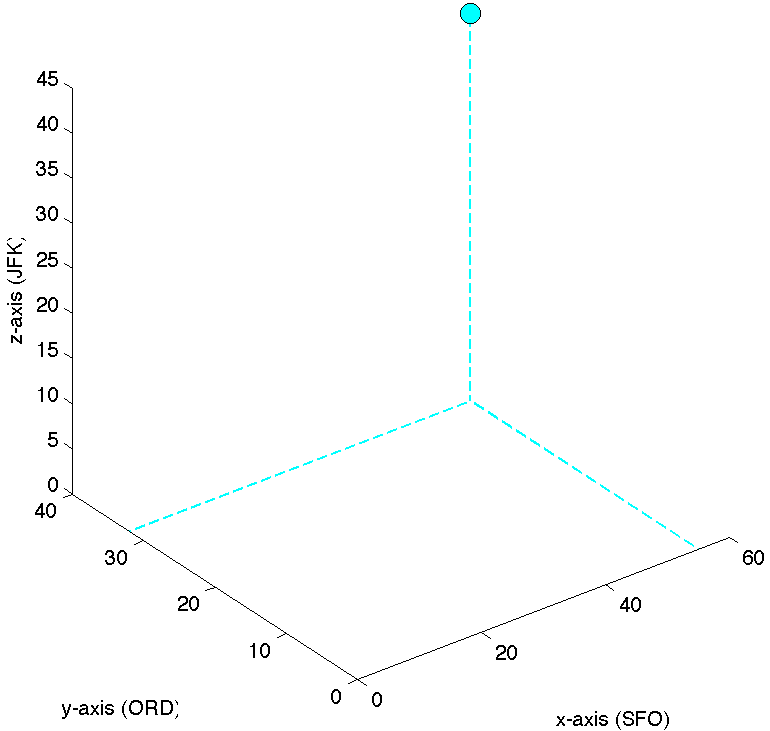 |
Alternatively, we can view the triple of temperatures as a point in a three-dimensional space. Each axis corresponds to temperatures at a specific location. The vector representation is still legible if we have more than one triplet of temperatures to represent. The vector representation cannot be viewed in more than three dimensions, that is if we have more than three cities involved. However, the data can still be represented as a collection of vectors. |
