Ask: How does population density vary?
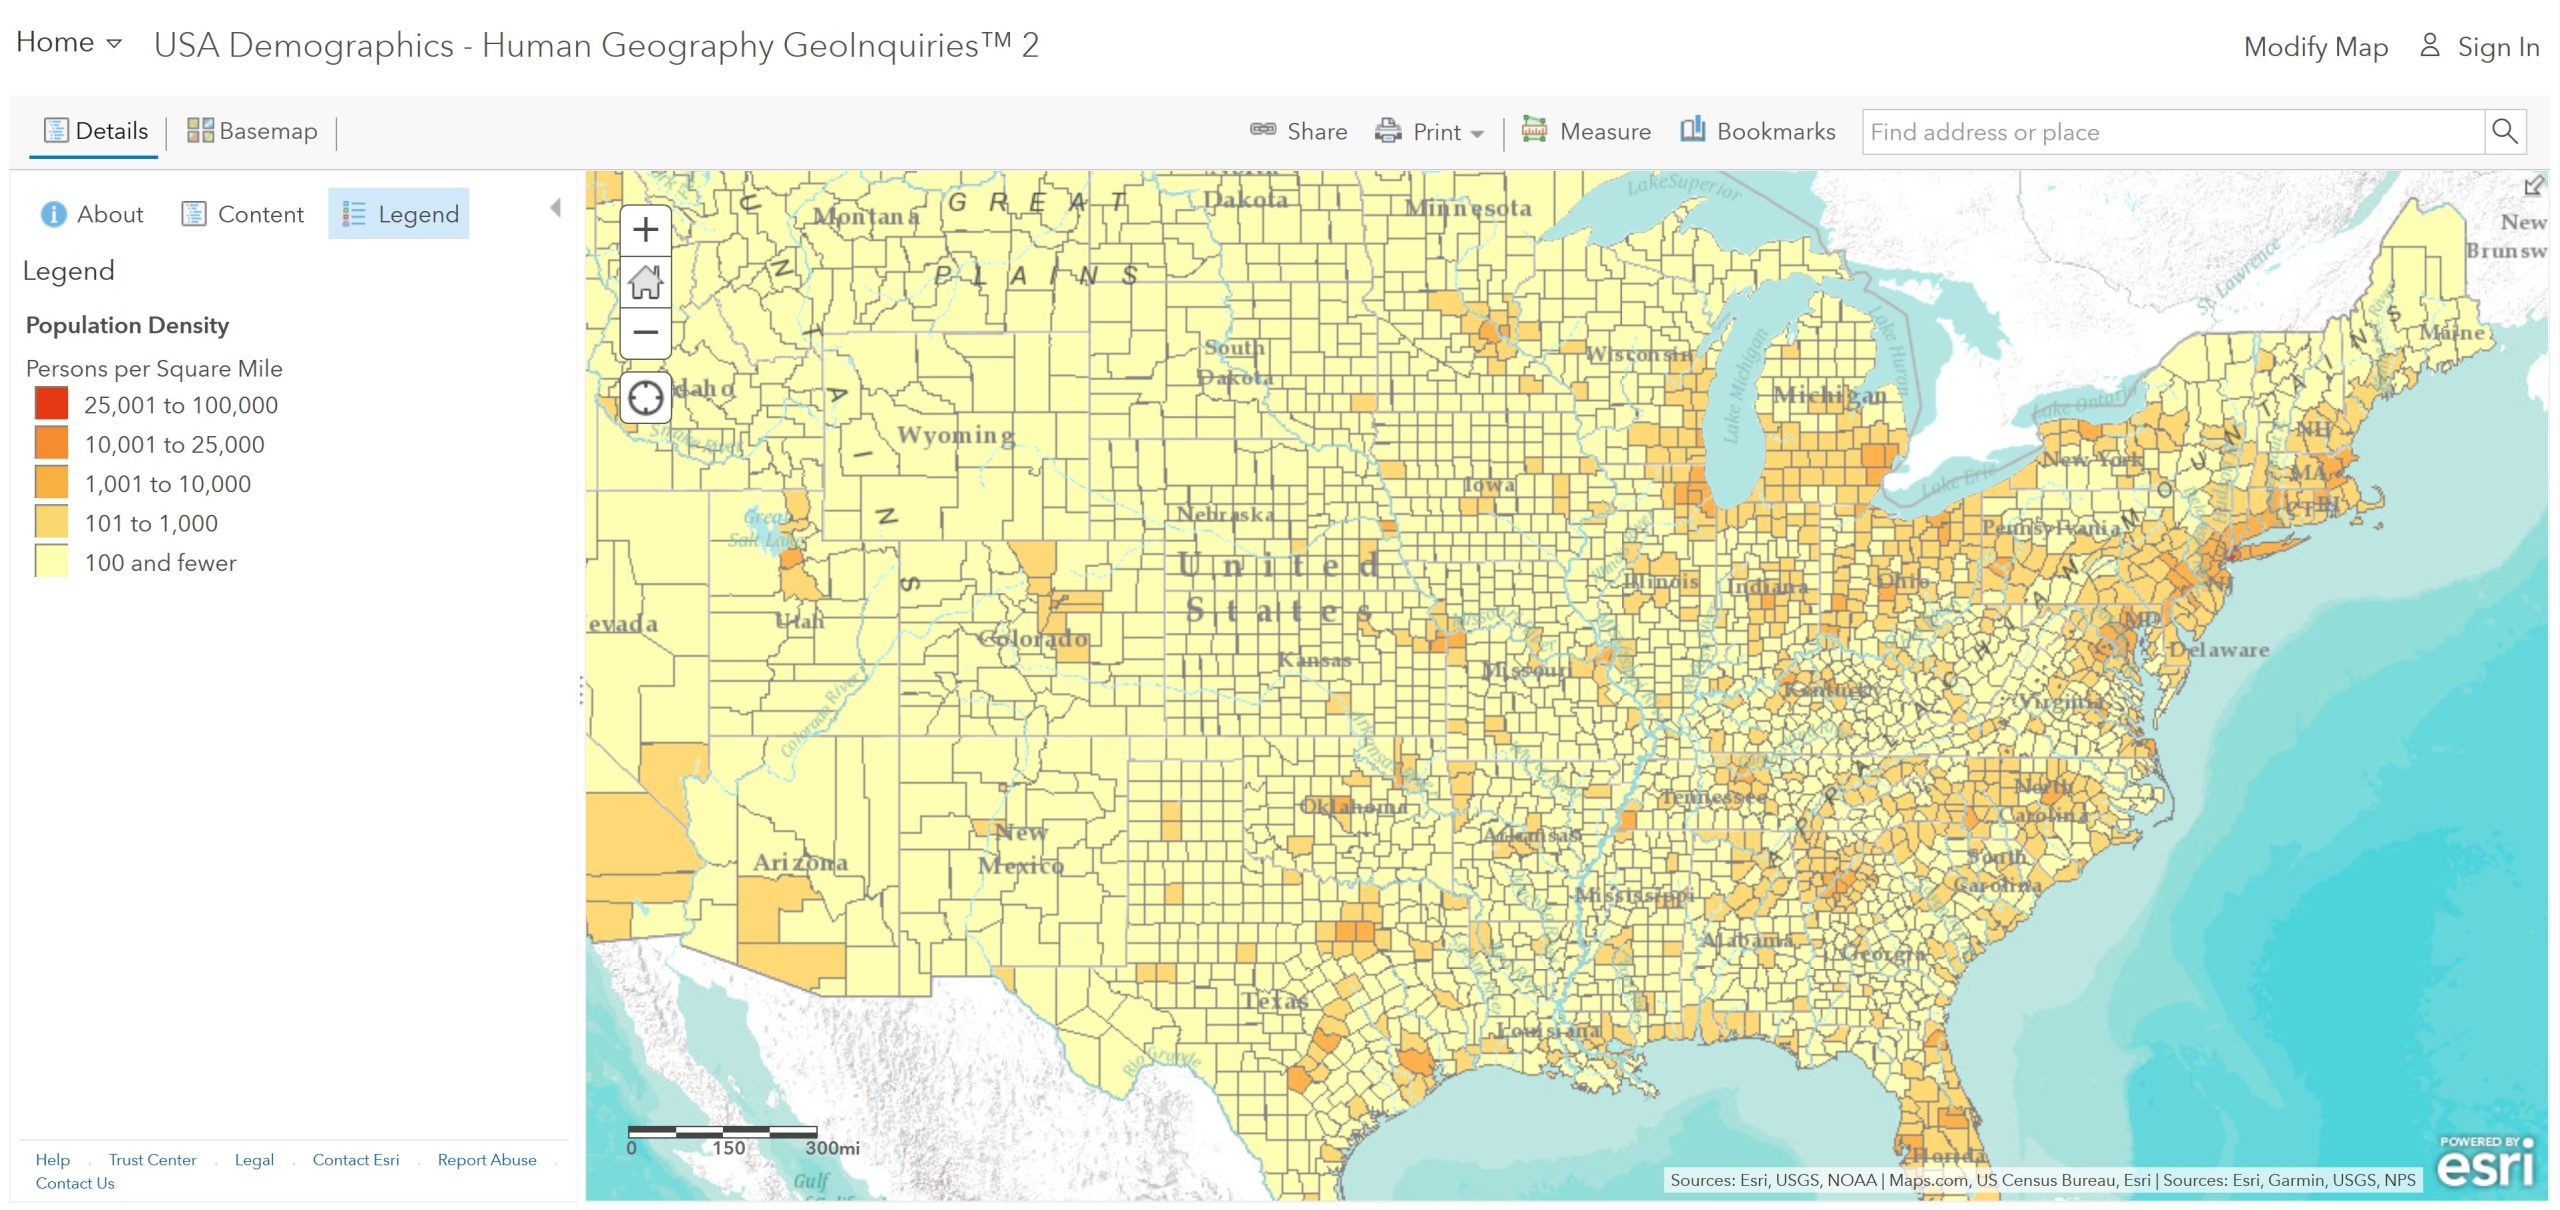
Step 1: Go to the ArcGIS Online map, USA Demographics, and explore the map.
- Which part of the United States is the most densely populated? Zoom into the most densely populated area.
- What happens when you zoom in?
Step 2: Slowly zoom in on New York City or another urban area.
- What pattern do you observe?
Acquire: Why does population density vary?
Step 3: With the Details button underlined, click the button, Show Contents of Map (Content).
Step 4: Check the box to the left of the layer, USA Topo Maps.
Step 5: Make the USA Population Density layer 40 percent transparent. To view two layers simultaneously, make one “see-through.” In the Contents pane, click the three dots beneath the layer name. Select, Transparency, and adjust it to 50 percent.
Step 6: Zoom and pan the map.
- How does physical geography affect population density?
Explore: How does income vary across the United States?
Step 7: Turn on the two layers, Median Household Income, and USA Major Cities.
Step 8: Turn off all the other layers.
Step 9: Click the button, Show Map Legend (Legend).
- How are median household income and cities related?
Analyze: How does age differ across the United States?
Step 10: Click the button, Show Contents (Content).
Step 11: Turn on the layer, Median Age. Turn off other layers. Choose the bookmark, State.
- Which state has the highest median age?
- Which five states show young populations?
Step 12: Click the button, Bookmarks. Select, County.
- How did the pattern change?
Step 13: Turn on the layer, Median Age-UT & FL Tracts. Zoom to Florida.
- Are all residents in Florida elderly?
- What could account for the many elderly in Florida?
Act: How does scale influence the interpretation of data?
Step 14: Utah has the lowest median age in the United States. Click the button, Bookmarks. Select Utah tracts.
- At this scale, which bordering state shows the sharpest contrast?
- What is surprising about Idaho is that at the state level, it is has a low median age. But at the county level, it has a higher median age areas.
Step 14: Click the button, Bookmarks. Select Oklahoma City.
- What age patterns do you observe?
https://www.youtube.com/watch?v=LXJz7ZfzAuM
