Ask: Where do crops grow best?
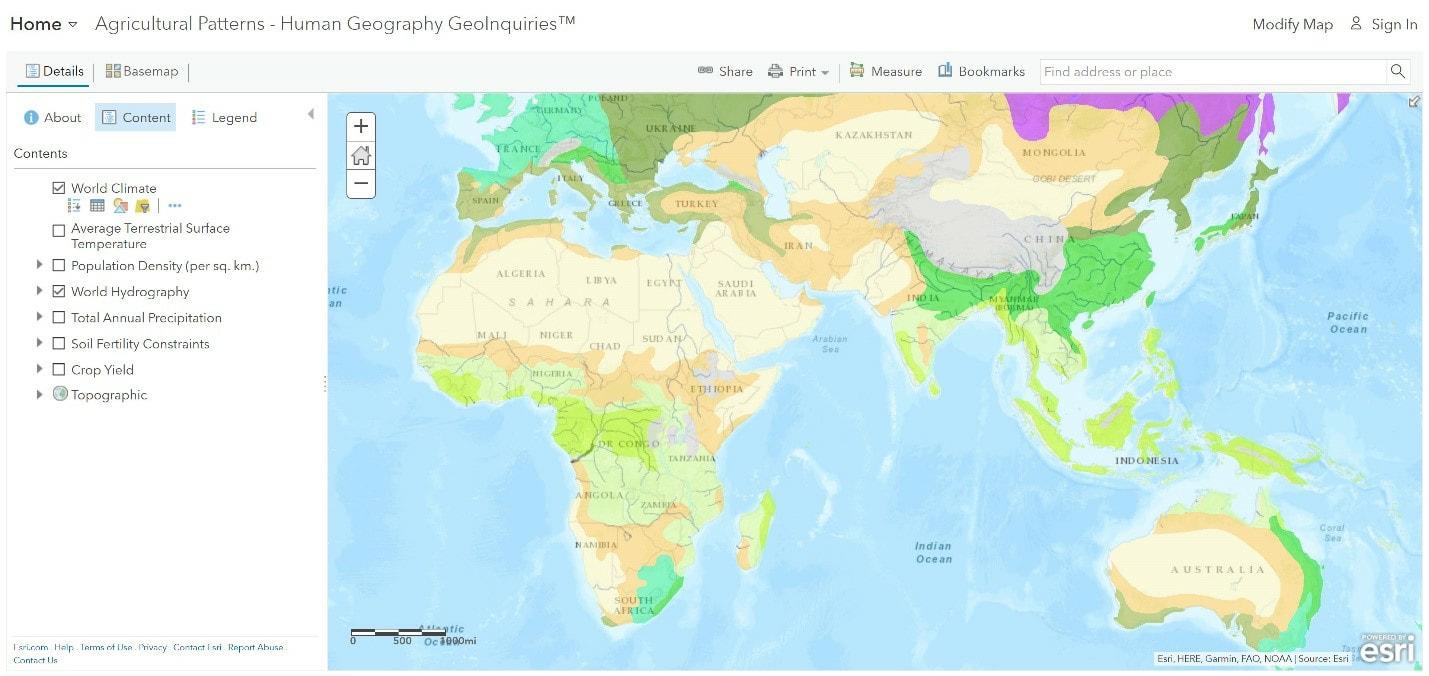
Step 1: Go to the ArcGIS Online map, Agricultural Patterns, and explore the map.
Step 2: Click the button, Bookmarks, and look at the various bookmarks for this map: Rocky Mountains, Egypt, Russia, Northern Africa, Eastern China.
The regions that have the most productive agricultural systems include Northern India because of its flat river valley plain; eastern China because of its temperature, climate, and regular rainfall; and southern Russia because of its excellent soil.
Acquire: what factors affect crop yield?
Step 3: With the Details button underlined, click the button, Content.
Step 4: To show a legend, click the layer name, Crop Yields.
Step 5: Click the button, Bookmarks. Select the North African bookmark.
- What are crop yields like in North Africa?
Step 6: Turn on the layer, Total Annual Precipitation.
- What observations can be made about precipitation?
Explore: does crop yield always depend on rainfall?
Step 7: Compare the precipitation and crop yield layers by turning them on and off.
- Crops can grow within the deserts despite the lack of precipitation because of nearby rivers and irrigation.
Step 8: Turn off the layer, Precipitation.
Step 9: Turn on the layer, World Hydro Reference Overlay.
Step 10: Click the button, Bookmarks. Select, Egypt. Note the dense crop yield near the mouth of the Nile and along it.
- The reason why a place with so little rain can be a productive agricultural region is that rainfall from the Ethiopian highlands flows north, creating the Nile River, a source of water and rich sediments for Egypt.
Analyze: what role does temperature play in crop YIELDS?
Step 11: Click the button, Bookmarks. Select, Russia.
- What pattern do you observe in northern Russia?
Step 12: Turn on the layer, Average Terrestrial Surface Temperature.
Step 13: Compare the crop yield and temperature layers by turning the layers on and off.
- Do the temperature crop yield layers show similar patterns?
- How do cold and freezing soil temperatures affect vegetation and crop yield?
Step 14: Turn on the World Climate layer and turn off the temperature layer.
Step 15: Click the darkest green areas of crop yields.
- Which climate zones correspond to areas with the highest crop yields?
Act: how does agriculture affect the population?
Step 16: Have only the Population Density and Crop Yield layers turned on.
Step 17: Compare the layers by turning them on and off.
- What is the relationship between agriculture and population density?
