Why do shapes of congressional districts vary from state to state?
Step 1: Go to the ArcGIS Online map, What is a Gerrymander, and explore the map.
- Gerrymandering is the drawing of congressional districts to favor one party or class over another (T/F)
Step 2: In the map, click a few districts to find the average number of people per district.
- What is the approximate average?
- Why do some states have more congressional districts?
What is the connection between population and district size?
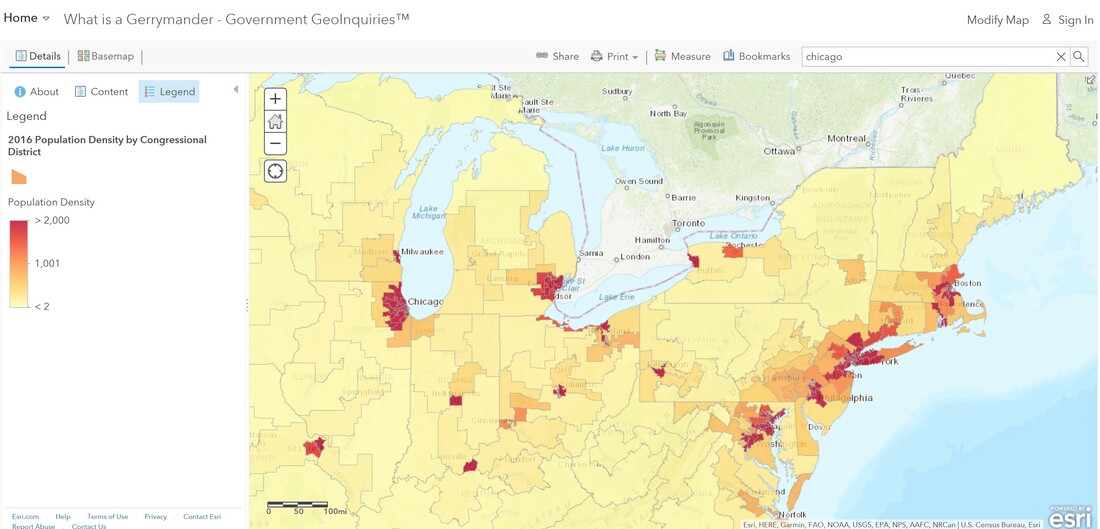
Step 3: With the Details button underline, press the button Show Contents of Map.
Step 4: Check the box to the left of the layer, 2016 Population Density by Congressional District.
Step 5: Uncheck the box to the left of the layer, USA 115 Congressional Districts.
Step 6: Click the map in a few districts to explore population density.
- What is the connection between population density and the size of congressional districts?
- The reason why the Constitution’s founding fathers created this system was so that each geographic area would have a representative, and states with more people would have more power in the House of Representatives. (T/F)
How can gerrymandering be recognized?
Step 7: Click Bookmarks and choose the Chicago Metropolitan bookmark.
Step 8: Turn on the Chicago Metro Districts layer and turn off all other layers.
- The Supreme Court ruled that districts must be drawn compact, contiguous, and have roughly equal populations. Which of Chicago’s districts appear to be the most gerrymandered?
How do party politics affect the drawing of districts?
Step 9: Select the bookmark, North Carolina.
Step 10: Turn on the two layers for North Carolina Congressional Districts.
- The state legislature is responsible for drawing district borders after each U.S. Census. Assuming support for the Republicans and Democrats are roughly equal, which political party likely had majority control when the districts were drawn? Why?
Step 11: Compare the 115 Congressional Districts to North Carolina’s previous districts by changing the transparency of one of the layers. From the Details pane, click the Show Contents of Map button. Point to a layer, click the three blue dots below the layer name, and choose Transparency. Modify the layer transparency to see an active layer below the top layer.
- Which seems to meet the court requirements better?
How do different states draw their congressional districts?
Step 12: Turn off all layers except the 2016 Congressional Districts layer.
Step 13: Type the name of a state into the search field to zoom to the state.
- Do the districts seem to be drawn fairly or not? What criteria did you use?
- Which districts seem to be the most gerrymandered in the state? Explain your reasoning.
