What is Development?
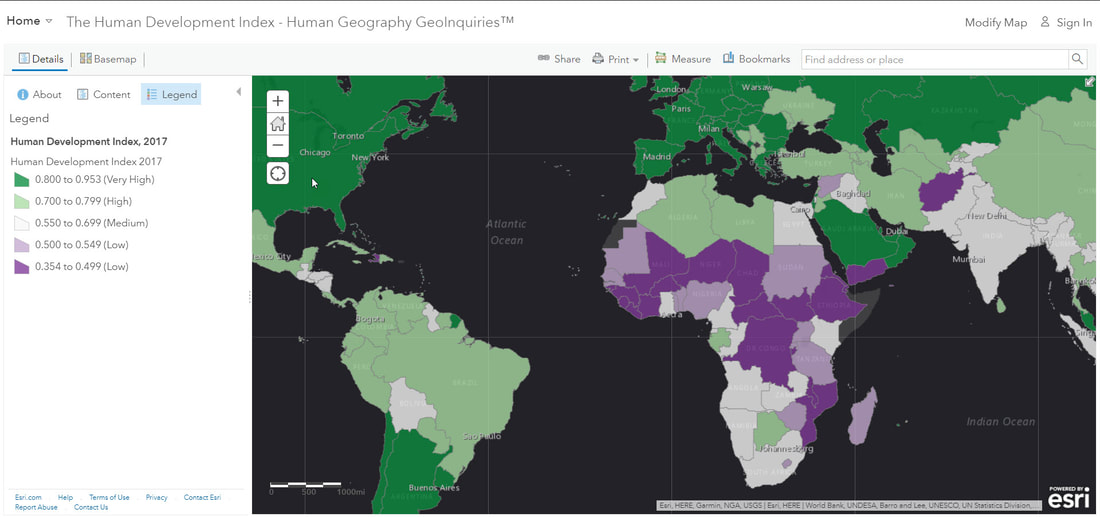
The United Nations created an index for health, education, and wealth indicators to assess a country’s level of development, called the Human Development Index. The statistical indicators for the index include life expectancy, education, and per capita income.
Step 1: Go to the ArcGIS Online map, The Human Development Index, and explore the map.
Step 2: Click on the United States and examine the pop-up. Repeat for Brazil and Pakistan.
- How does the Human Development Index vary for these countries?
- Which two regions are the most developed in the world?
How does crime affect development?
Step 3: With the Details button underlined, click the button, Show Contents of Map (Content).
Step 4: Uncheck the box to the left of the layer name, Human Development Index, 2017.
Step 5: Turn on the layer, Murder Rates per 100,000.
Step 6: Click the button, Bookmarks. Select Central America.
- Which country has the highest 2015 murder rate?
- What correlation is there between development and crime?
What effect does the birth rate have on development?
Step 7: Sow the layer, Total Fertility Rate.
Step 8: Filter the data to find regions with the highest fertility rates.
Step 9: From the Contents pane, click the button, Filter.
Step 10: Build the query: Total Fertility Rate 2016 Is Greater Than 3 (value).
- Higher fertility rates correlate with higher levels of development. (T/F)
Step 11: Turn off the layer, Total Fertility Rate.
How does gender inequality affect development?
Step 12: Turn on the two layers: Gender Inequality Index and the GNI Per Capita.
Step 13: Compare the two layers by turning them on and off.
- Wealthier countries tend to have less gender inequality. (T/F)
Step 14: Explore the regions of the world, visually.
- Is there a region that has very high per capita income, but also experiences high levels of gender inequality?
- How do income and gender inequality affect a country’s HDI ranking?

