Chapter 11: Food Insecurity and Food Waste
“There are people in the world so hungry that God cannot appear to them except in the form of bread.”
-Mahatma Gandhi
Physiologically, hunger is the body’s response to a need for nourishment. Through stomach discomfort or intestinal rumbling, the body alerts the brain that it requires food. This uneasy sensation is easily addressed with a snack or a full meal. However, the term “hunger” also relates to a weakened condition that is a consequence of a prolonged lack of food. People who suffer from this form of hunger typically experience malnourishment, along with poor growth and development. Hunger and malnutrition occur in every country in the world. At the same time, it is estimated that more than 30% of food in the US is discarded uneaten.
Learning Objectives
- Define food security and food insecurity including the various levels of insecurity.
- Describe who is affected by food insecurity in the US and the world and why.
- Define food deserts and food swamps.
- Differentiate among programs in the US that address food insecurity.
- Describe the problem of food waste and interventions for its reduction.
11.1 Definitions and Scope
Adequate food intake that meets nutritional requirements is essential to achieve a healthy, productive lifestyle. The United Nations Food and Agriculture Organization (FAO) estimates that approximately 815 million people (or 10.7%) of the 7.6 billion people in the world suffered from chronic undernourishment in 2016. Almost all of these hungry people live in lower and middle-income countries.1 However, millions of people in North America go hungry and are malnourished each year due to a recurring and involuntary lack of food. The economic crisis of 2008 caused a dramatic increase in hunger across the US as did the Covid-19 pandemic in 2020-21. According to Feeding America (a non-profit organization), more than 54 million people may have experienced food insecurity in 2020, and as many as 18 million were children. That’s up from 37 million in 2018. Rural, urban, and suburban communities contain people who lack access to adequate healthy foods, and many who are hungry do not qualify for federal aid to help them feed themselves and their families.2
Key Hunger Terms
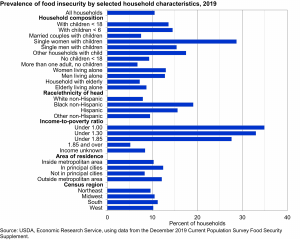
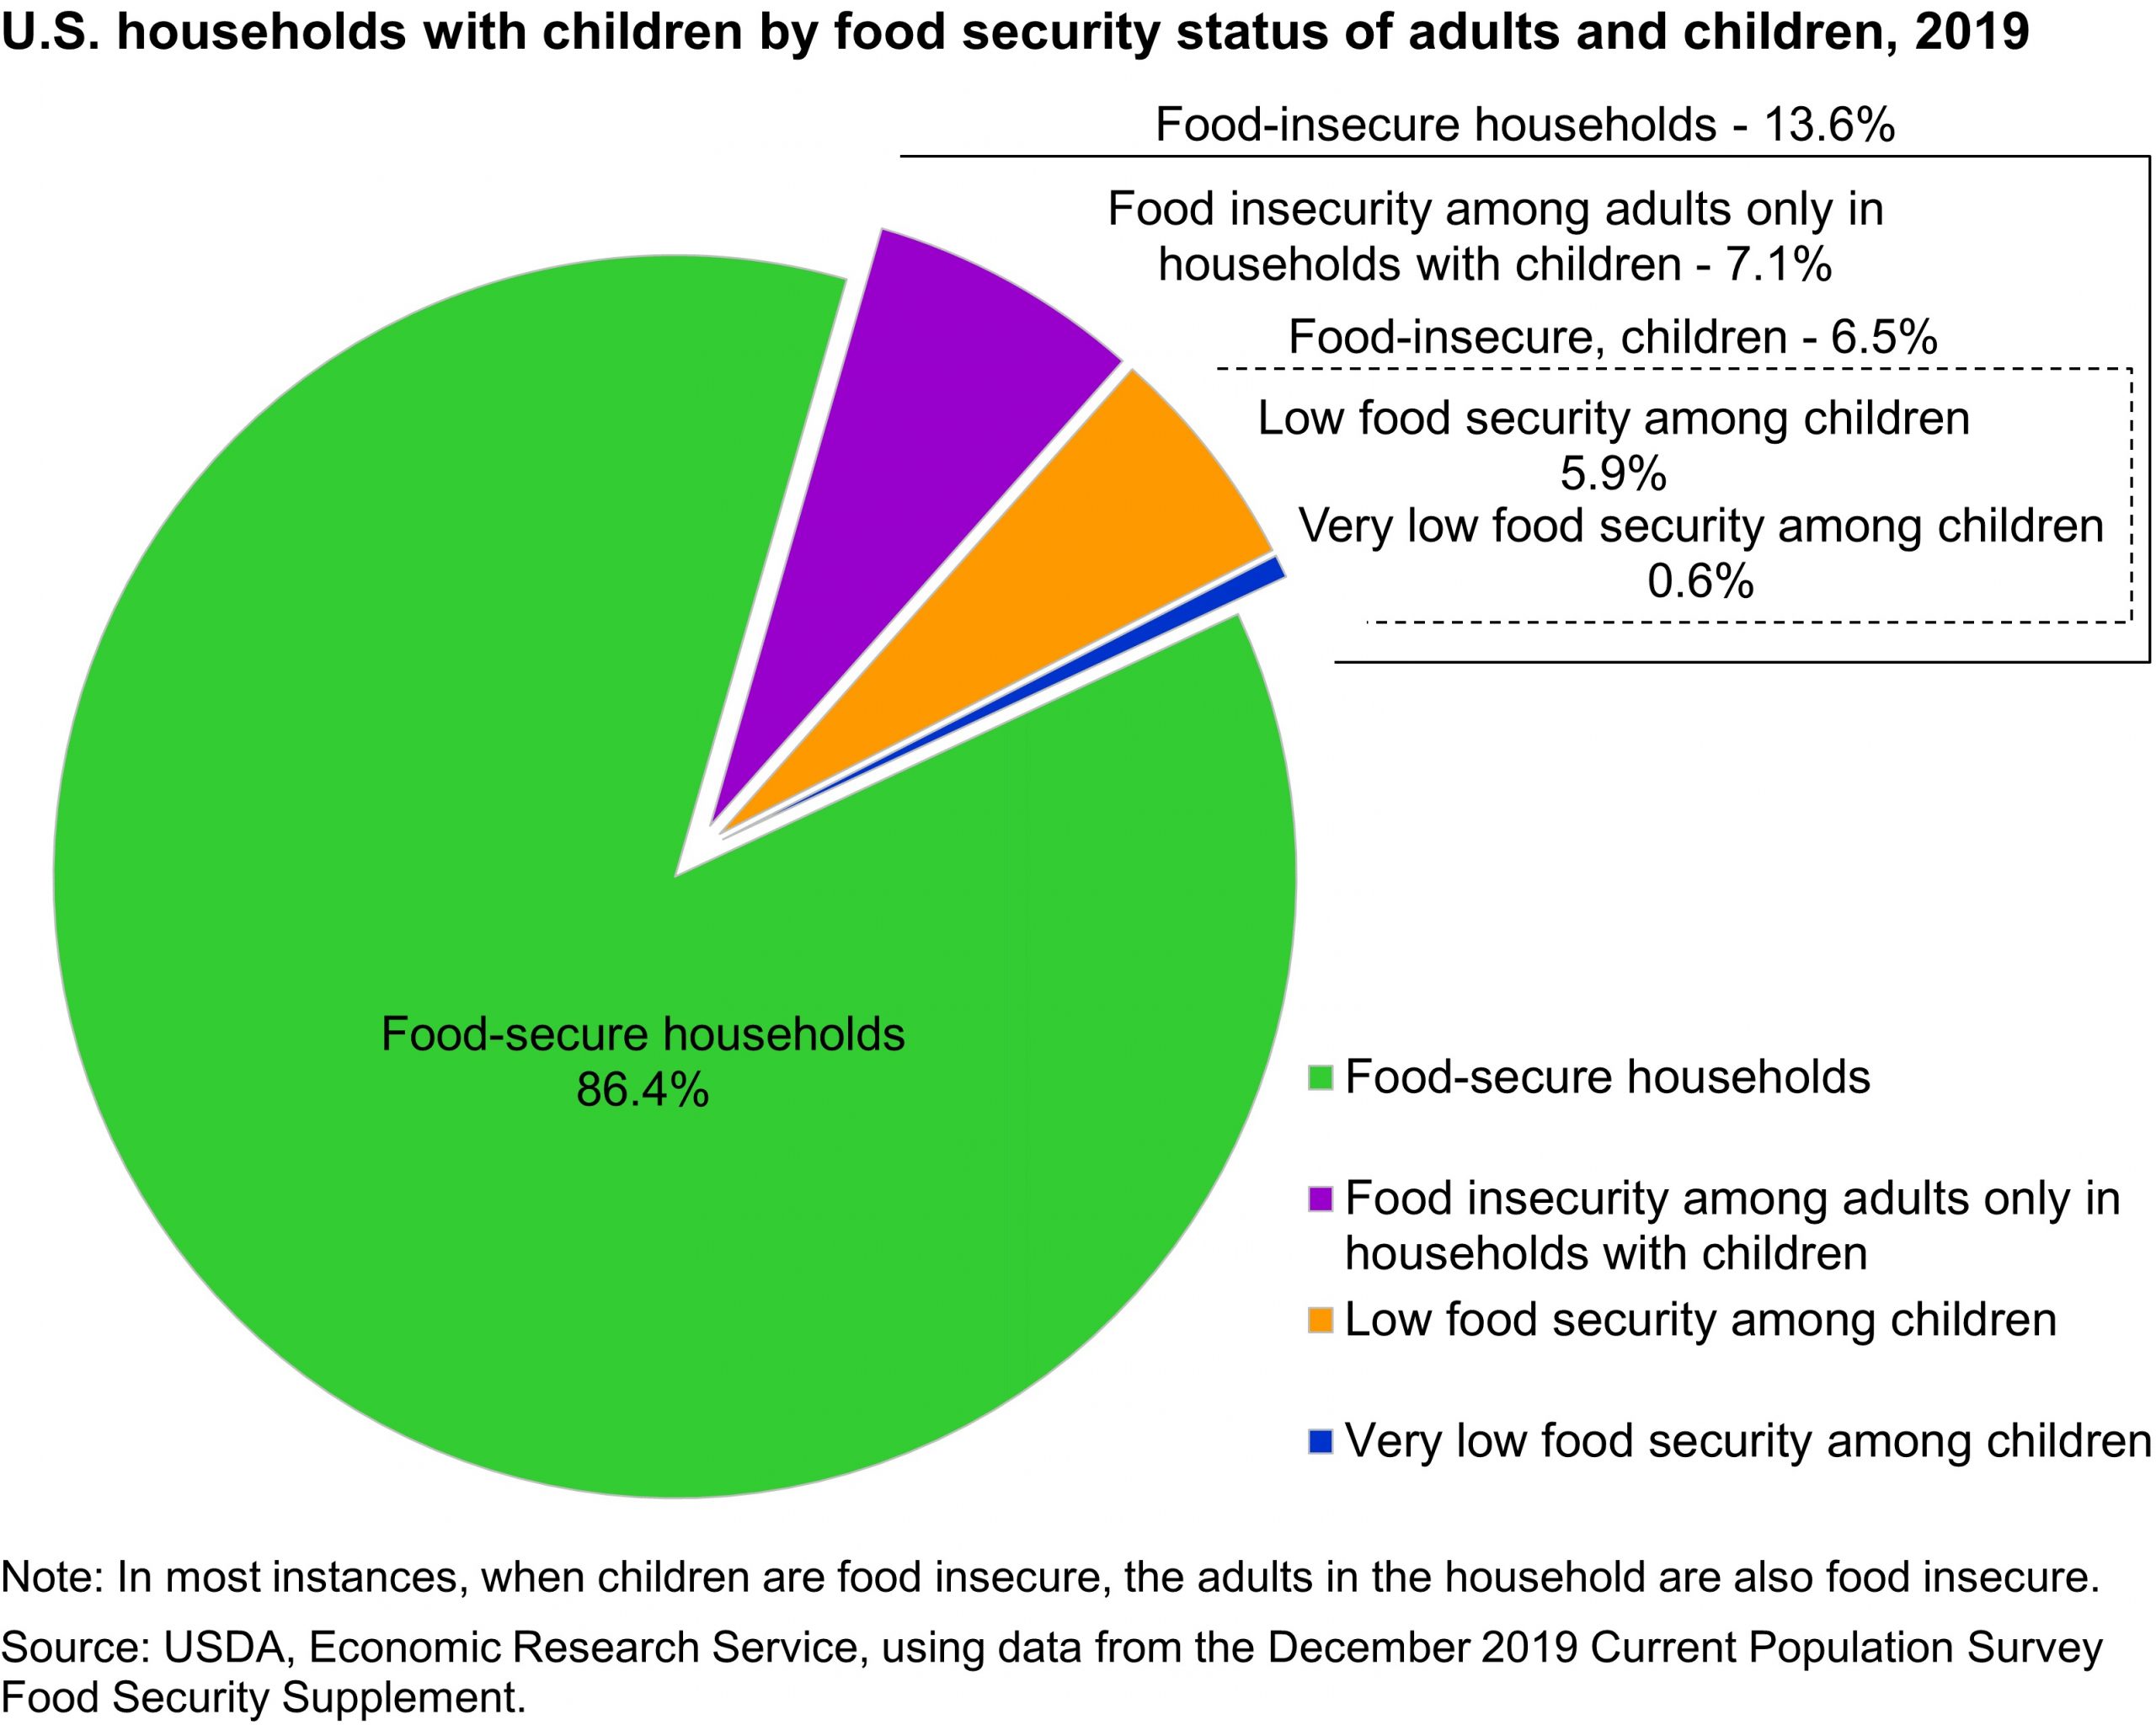
A number of terms are used to categorize and classify hunger. Two key terms, food security and food insecurity, focus on status and affect hunger statistics. Most American households (~89%) are considered to be food secure, which means they have adequate access to food and consume enough nutrients to achieve a healthy lifestyle. There is a continuum of food security in the US ranging from high to very low (Table 10.1.1). A minority of US households in 2018 experienced low food security (about 1 in 9 people; 14 million households) at certain points during the year, and some had very low food security (about 1 in 25; 5.6 million households) which means their access to food is significantly and chronically limited due to a lack of money or other resources. Rates of low and very low food insecurity are higher for households with very low income, especially those with children headed by a single parent, women or men living alone, households in principal cities, and Black- or Hispanic-headed households.3
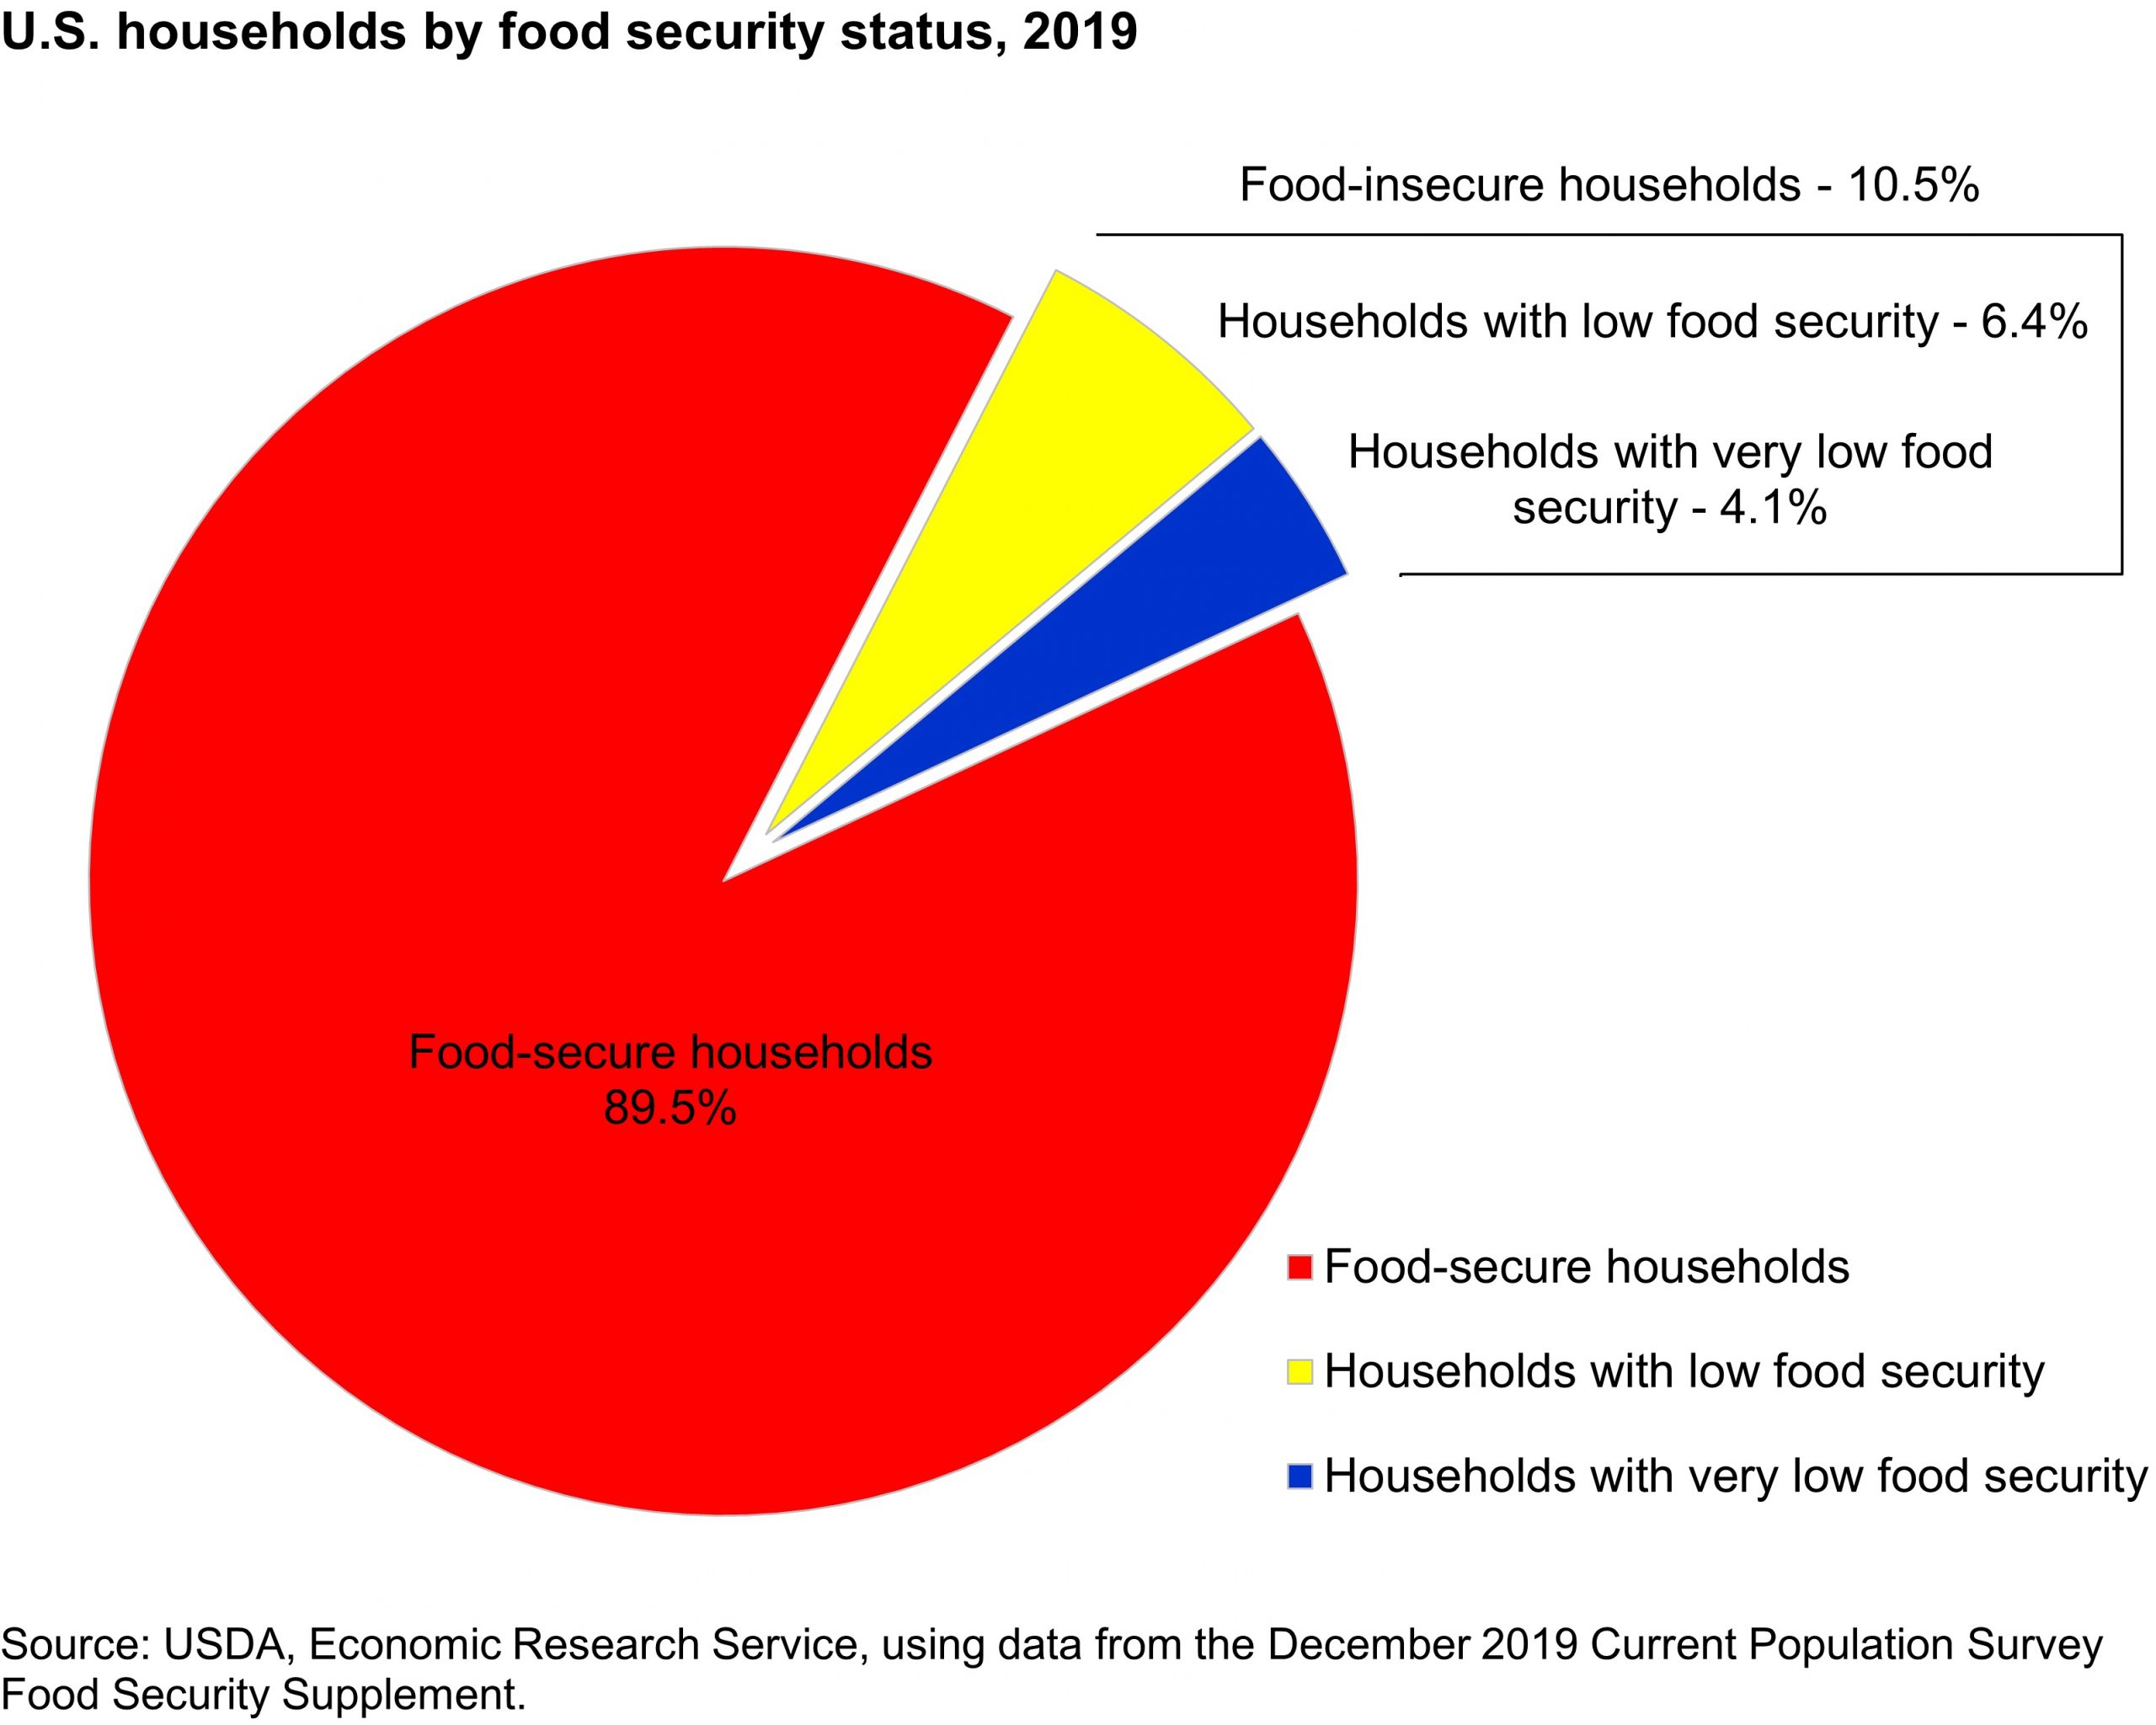
Table 11.1.1 Definitions of Food Security4
| Type of Food Security | Definition |
| High | No reported indications of food access problems or limitations. |
| Marginal | One or two reported indications—typically of anxiety over food sufficiency or shortage of food in the house; little or no indication of changes in diets or food intake. |
| Low | Reports of reduced quality, variety, or desirability of diet. Little or no indication of reduced food intake. |
| Very Low | Reports of multiple indications of disrupted eating patterns and reduced food intake. |
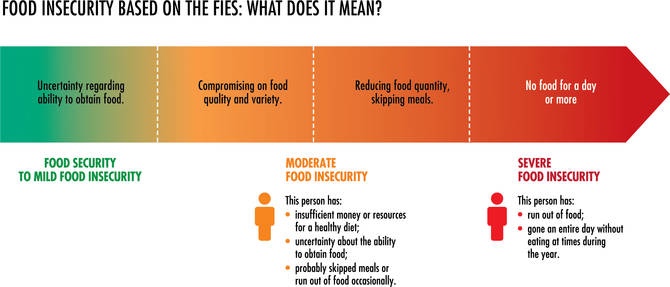
The FAO uses a Food Insecurity Experience Scale (FIES) to measure food insecurity.5
Households with limited resources employ a variety of methods to increase their access to adequate food. Some families purchase junk food and fast food—cheaper options that typically consist of high energy, low nutrient dense options. Other families who struggle with food security supplement the groceries they purchase by participating in government assistance programs. About 56% of food insecure households reported using a federal nutrition assistance program like the Supplemental Nutrition Assistance Program (SNAP), Special Supplemental Nutrition Program for Women, Infants, and Children (WIC), or the National School Lunch Program during the past month.3 They may also obtain food from emergency providers, such as food banks, food pantries, and/or soup kitchens in their communities.
Malnutrition
A person living in a food insecure household may suffer from malnutrition, which results from a failure to meet nutrient requirements. This can occur as a result of consuming too little food or not enough key nutrients. There are two basic types of malnutrition. The first is macronutrient deficiency and relates primarily to the lack of adequate protein, which is required for cell growth, maintenance, and repair. The conditions marasmus and kwashiorkor, discussed in Chapter 6, are examples of this type of malnutrition. The second type of malnutrition is micronutrient deficiency and relates to inadequate vitamin and mineral intake.1 Often called “hidden hunger” because their effects may not be obvious, these micronutrient deficiencies can have multiple and lasting effects. The most commonly deficient micronutrients with long term consequences are vitamin A, iron, and iodine.6 People who consume adequate calories and protein can suffer from this type of micronutrient malnutrition if they eat foods that do not meet all of their nutritional needs.
11.2 At-Risk Groups
Worldwide, three main groups are most at risk of hunger: the rural poor in developing nations who also lack access to electricity and safe drinking water, the urban poor who live in expanding cities and lack the means to buy food, and victims of earthquakes, hurricanes, and other natural and man-made catastrophes.5 In the US we also see high rates of hunger and malnutrition in both rural and urban areas, but there are additional subgroups that are at risk and are more likely than other Americans to face these maladies. They include low income families and the working poor, who are employed but have incomes below the federal poverty level, the homeless, seniors, children, and some college students.
Low-income Families/Working Poor
Often people suffering from malnutrition, especially the micronutrient deficiency form, live in food deserts, geographic areas where access to affordable, healthy foods (especially fresh fruits and vegetables) is limited or non-existent, primarily because of a lack of grocery stores within traveling distance. This can occur in both rural and urban settings. In an urban area, an area is a food desert if a full-service grocery store is not available within one mile of a location. Rural food deserts are generally defined as a county where residents must drive more than 10 miles to access a supermarket or grocery store. About 20% of rural counties in the US are considered rural food deserts.7
Food deserts are more likely to occur in areas with high minority populations and low incomes. These areas do not have grocery stores, and many urban residents do not have cars, relying on public transportation. In rural areas, public transportation is unavailable so low income residents have to find personal transport, often in unreliable vehicles. A trip to a grocery store could take several buses and/or several hours, and the working poor have little money or time to spend accessing these locations. Instead, they must rely on fast food restaurants selling cheap meat and dairy, or convenience stores selling processed foods like soda, chips, or other “junk food.” These areas are called food swamps.8 Although this sounds similar to a food desert, and often they occur in the same area, a food desert is defined by what is not available (a grocery store) whereas a food swamp is defined by what is available (only fast food/junk food). Often the food items sold in these types of restaurants or in convenience stores are not culturally appropriate, are not suitable for those with dietary restrictions due to underlying medical conditions such as lactose or gluten intolerance, type 2 diabetes, hypertension, or other forms of cardiovascular disease, and are significantly more expensive.9 These types of food environments can also partly explain the higher rates of adult obesity in populations living in these areas.8
Seniors
Senior citizens are a major at-risk group for food insecurity. Many elderly people are frail and isolated, which affects their ability to meet their dietary requirements. In addition, many also have low incomes, limited resources, and difficulty purchasing or preparing food due to health issues or poor mobility. As a result, more than nine million senior citizens in the US face the threat of hunger, and more than five million have low or very low food security.10
The Homeless
One of the groups that struggles with hunger are the millions of homeless people across North America. According to data from the 2020 Annual Homeless Assessment Report by the US Department of Housing and Urban Development, homelessness has been increasing annually for the past four years.11 Hunger and homelessness often go hand-in-hand as homeless families and adults turn to soup kitchens, food pantries, and/or resort to begging for food.
Children
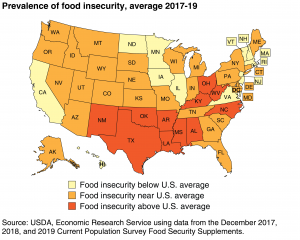
Rising hunger rates in the US particularly affect children. More than one out of five children, or 21.6% of all American children, live in a food insecure household and spend at least part of the year hungry.3 Often their only daily meals occur at school. Although the prevalence of food insecurity varies, rates are higher than the national average in households with children, especially children under age six and headed by a single parent who is Black or Hispanic (especially if the single parent is female). There is also more food insecurity in Southern states.12 Hunger delays growth and development and affects educational progress because it is more difficult for hungry or malnourished students to concentrate in school. In addition, children who are undernourished are more susceptible to contracting diseases, such as measles and pneumonia.1
College Students
In recent years there has been a realization that college students are more likely to be food insecure than ever before. Surveys report that about 15% of students are food insecure with another 16% at risk for food insecurity. Food insecurity is more common in students of color, those who receive multiple forms of financial aid, and those who are also experiencing housing problems.13 In a large national survey of 43,000 students at both community colleges and universities, 36% reported food insecurity in the last 30 days, 36% also had housing insecurity, and 9-12% reported that they were homeless.14 It’s difficult for students who are hungry or homeless to be successful in college, so many college campuses now have food pantries and food and housing assistance programs for their students in need.
11.3 Programs to Combat Hunger
The federal government has established a number of programs that work to alleviate hunger and ensure that many low income families receive the nutrition they require to live a healthy life. A number of programs were strengthened by the passage of the Healthy, Hunger-Free Kids Act of 2010. This legislation authorized funding and set the policy for several key core programs that provide a safety net for food insecure children across the US. In addition to federal programs, many state and local governments and charitable organizations work tirelessly to help combat hunger.
The Federal Poverty Threshold and Guidelines
Each year, usually in January, the federal government publishes poverty thresholds put out by the Census Bureau, and poverty guidelines published by the Department of Health and Human Services (HHS). The threshold is used primarily for calculating all official poverty statistics. The poverty guidelines are used for determining financial eligibility for federal programs including those for food assistance. This monetary figure is the minimum amount that a family would need to acquire shelter, food, clothing, and other necessities. It is calculated based on family size and is adjusted for annual inflation. In 2020, the poverty guideline for a family of four was $26,200 for the 48 contiguous states (it’s 15-25% higher in Hawaii and Alaska). Although many people who fall below the guidelines are unemployed, the “working poor” can qualify for food programs and other forms of public assistance if their income is less than a certain percentage (125-185% depending on the program) of the federal poverty guideline, along with other qualifications.15
USDA Food Assistance Programs
Government food and nutrition assistance programs that are organized and operated by the US Department of Agriculture (USDA) work to increase food security. They provide low income households with access to food, the tools for consuming a healthy diet, and education about nutrition. The USDA monitors the extent and severity of food insecurity via an annual survey. This contributes to the efficiency of food assistance programs as well as the effectiveness of private charities and other initiatives aimed at reducing food insecurity.3
The Supplemental Nutrition Assistance Program
Formerly known as the Food Stamp Program, the Supplemental Nutrition Assistance Program (SNAP) provides monthly benefits for low income households to purchase approved food items at authorized stores. Clients qualify for the program based on available household income, assets, and certain basic expenses. In an average month, SNAP provides benefits to more than 40 million people in the US. The program provides Electronic Benefit Transfers (EBT) which work similarly to a debit card. Clients receive a card with a certain allocation of money for each month that can be used only for food. In 2018, the average benefit was about $126 per person per month (down from $134 per person in 2010), and total federal expenditures for the program were $65 billion (down from $68.2 billion in 2010).3
The Special Supplemental Program for Women, Infants, and Children (WIC)
The Special Supplemental Program for Women, Infants, and Children (WIC) provides food packages to pregnant and breastfeeding women, as well as to infants and children up to age five, to promote adequate intake for healthy growth and development. Most state WIC programs provide vouchers that participants use to acquire specific types of foods and infant formula at most food stores. In 2018, WIC served approximately 6.9 million participants per month (down from 9.2 million in 2010) at an average monthly cost of about $42 per person.3
The National School Lunch Program
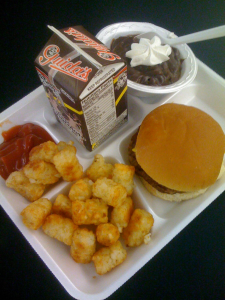
The National School Lunch Program (NSLP) was established in 1946. The first year approximately 7 million children participated, and in 2018 the program had grown to almost 30 million children. The School Breakfast Program (SBP) was added in 1966. The program works to ensure that children in elementary and middle schools receive at least one healthy meal each school day, or two if both the NSLP and SBP are provided. According to the USDA, these programs operate in over 100,000 public and nonprofit private schools and residential child care institutions.16 In 2018, the programs provided meals to an average of 29.7 million children each school day. About 68% of the lunches served were free, and an additional 6% were provided at reduced prices.3 Schools are reimbursed at varying rates per state. In Texas, for example, schools received $3.41 for each free lunch they provided in the 2019-2020 school year, and $1.84 for breakfast.17 In addition to reimbursement for meals, the program provides healthy eating programming and educational materials. Figure 11.3.2 illustrates some of the
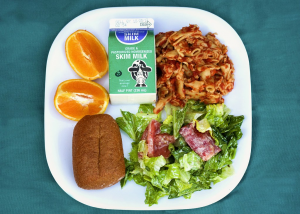
nutritional improvements made to school lunches as a result of the updated standards set forth by the Healthy, Hunger-Free Kids Act of 2010, compared to Figure 11.3.1 illustrating a “classic” school lunch. Since 2012, every school lunch must provide students a balanced meal, containing vegetables, fruit, low- or non-fat dairy, at least 50% whole grains, and lean protein. There are also limits on the amount of sodium, saturated fat, trans fat, and kcal that can be provided by the meal. All NSLP meals must meet the nutritional requirements set by Congress and the USDA, but decisions about the foods served and their preparation are made by local school authorities.16
Other Food Assistance Programs
Other government programs provide meals for children after school hours and during summer breaks. The Child and Adult Care Food Program (CACFP) offers meals and snacks at child care centers, day care homes, and after school programs for children, and for nonprofit adult day care programs. Through CACFP, more than 4.2 million children and 130,000 adults receive nutritious meals and snacks each day.18
The Summer Food Service Program provides meals to children during summer break. Sponsors include day camps and other recreation programs where at least half of the attendees live in households with incomes below the federal poverty level.19 These and other programs help to fill in the gaps during the typical day of a food insecure child.
Head Start is a health and development program for children ages three to five, from low income families. The philosophy behind the organization is that early intervention can help address the educational, social, and nutritional deficiencies that children from lower income families often experience. Launched in 1965, it is one of the longest running, poverty-related programs in the US. Today, Head Start programs include education, meals, snacks, and access to other social services and health guidance.20
Other Forms of Assistance
Other forms of assistance include locally operated charitable organizations, such as food banks and food pantries, which acquire food from local manufacturers, retailers, farmers, and community members to give to low income families. Neighborhood soup kitchens provide meals to the homeless and other people in need. These and other organizations are run by nonprofit groups to provide an additional safety net for those in need of food.
Food Banks & Food Pantries
Food banks are nonprofit organizations that collect and distribute food to charities that work to reduce hunger. In the US there are hundreds of food banks that provide food storage and distribution depots, but do not necessarily give out food directly. Food banks in the US are very diverse—from small operations serving people spread out across large rural areas to very large facilities that store and distribute many millions of pounds of food each year, and everything in between. A variety of factors impact how food banks work, from the size of the facility to the number of staff members. Food pantries distribute food directly to those who need it, often obtaining food from food banks. There are more than 60,000 food pantries in the US located in schools, religious organizations, businesses, and many other sites in a community. Usually they distribute foods to clients once or twice per month. Both food banks and food pantries rely on food and monetary donations and volunteers to help them sort, store, and distribute billions of meals to those in need.21 If you’re considering donating to a food bank or pantry, Table 10.3.1 provides information about the items most requested and needed. Becoming a volunteer is also a great way to support these organizations.
Table 11.3.1 Food Bank and Food Pantry Donation Recommendations22
| Type of Donation | |
| Monetary | Monetary donations make the greatest impact. Because food banks buy in bulk, many can stretch a $10 donation into more than 40 meals and purchase food items that are already sorted and on pallets making them easier to distribute to food pantries |
| Nutritious Items* | Canned meats and fish, whole grains like quinoa or spelt, brown or wild rice, steel cut or rolled oats, whole grain cereals with at least 5 grams of fiber per serving, whole grain pastas, fruits in natural juice (no sugar added), canned vegetables (low salt or no salt added), canned fruit packed in water (not syrup), canned or boxed low sodium soups or stews, dried or canned legumes (peas, beans, lentils, peanuts), pureed foods (pumpkin, applesauce, sweet potato), low fat dry or shelf stable milk, nut butters (peanut, almond) |
| Other items to stretch food budgets | Dried herbs and spices, popcorn kernels, dried fruits, granola, shelf-stable milk substitutes (soy, almond, rice, oat), seeds and nuts (unsalted or low salt), healthy cooking oils, natural sweeteners (honey), 100% fruit juice |
| Hygiene items | Shampoo, conditioner, soap, dish soap, combs, brushes, razors, lotion, toothpaste, toothbrushes, feminine hygiene products, etc. |
| Baby items | Diapers (all sizes), baby wipes, baby food, formula |
| Cooking items | Can openers, pans, utensils, storage containers, and bags |
*Keep in mind that many clients may not have access to cooking facilities. Choose no-cook items with pop top lids or easy-to-open packaging.
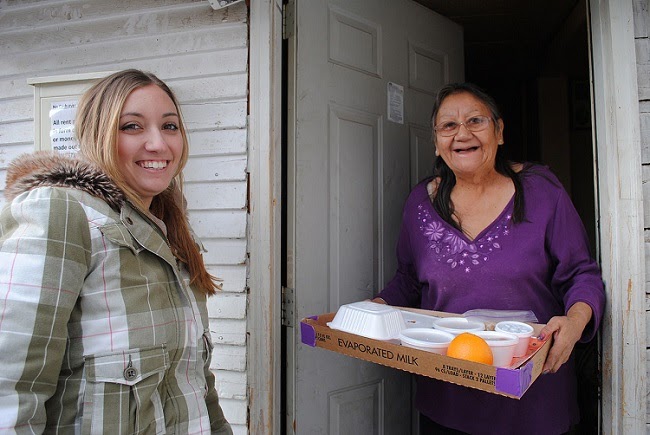
Meals on Wheels
There are several other nonprofit organizations in the US that aid those who may suffer from hunger. An organization known as Meals on Wheels delivers meals to elderly people who have difficulty buying or making their own food because of poor health or limited mobility. It is the oldest and largest program dedicated to addressing the nutritional needs of senior citizens. Each day, Meals on Wheels volunteers deliver more than one million meals across the US. The first Meals on Wheels program began in Philadelphia in the 1950s. In the decades since, the organization has expanded into a vast network that serves the elderly in all 50 states and several US territories. Today, Meals on Wheels remains committed to ending hunger among the senior citizen community.10
Food For Thought
Do you believe there are enough government programs currently in place to address the problem of hunger? Why or why not? If not, what additional solutions would you recommend?
11.4 Food Loss and Food Waste
Food loss is the edible amount of food, postharvest, that is available for human consumption but is not consumed for any reason.23 The FAO defines it as “any food that is discarded, incinerated, or otherwise disposed of along the food supply chain from harvest or slaughter.”24 In addition to natural shrinkage through cooking or moisture loss, these losses include spoilage, contamination by insects, rodents, birds, molds, or bacteria, or issues with transport or storage. Food loss occurs at every stage of production.
Food waste is the decrease in quality or quantity of food resulting from actions of retailers, food service providers, and consumers.24 At the retail level, foods can be damaged by equipment malfunction such as problems with refrigeration, or foods can be stored improperly. Blemished produce is not considered optimal and is thrown away during sorting. Date labeling, as discussed in previous chapters, causes many foods to be discarded by both retailers and consumers although it is still safe to consume. Restaurants and households discard edible foods that are unused or leftover for various reasons.23 Food that is produced but not eaten also wastes precious resources such as land, water, energy, soil, and seeds. It also needlessly increases greenhouse gas emissions since food waste breakdown creates methane.24
Although the actual amount is difficult to measure, estimates indicate that about one third of food is wasted worldwide.24 The USDA estimates this is about 133 billion pounds of food or 30-40% of the US food supply. This translates to about 219 pounds per person costing $162 billion.23 The Environmental Protection Agency (EPA) estimates that food waste comprised approximately 23% of our landfills and incineration facilities in 2018. That waste alone in landfills generates 20% of the US methane emissions.25
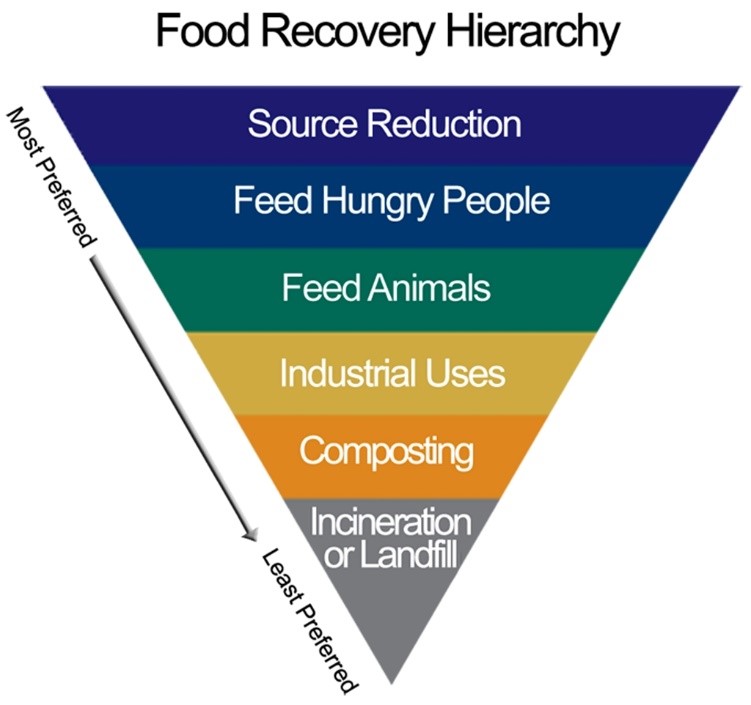
Many organizations are trying to tackle this global problem. The best way to reduce food loss and waste is to not create it in the first place. Improved product development, storage, shopping and ordering, marketing, labeling, and cooking methods can all contribute to this reduction. The FAO works with governments and other international groups promoting awareness and assisting with policy development. They also coordinate with food supply chains from farmers to processors and traders to educate and assist in loss and waste reduction.24 The USDA has partnered with the EPA to try to tackle this problem with the goal of reducing food loss and waste by 50% by the year 2030.25 Together they developed a Food Recovery Hierarchy. The most preferred method of reducing food loss and waste is source reduction followed by using excess foods to feed hungry people, feed animals, use in industry, or composting. The last resort should be sending excess food to a landfill or incinerator.26
Source Reduction
Source reduction is the best way reduce food loss and waste. It can prevent pollution related to food production, reduce methane emissions from landfills, and it can save money and labor costs by encouraging buying only what is needed, avoiding disposal costs, and providing more efficient handling, preparation and storage of food that will actually be used. To do this, businesses or individuals can conduct a food waste audit by recording what is being thrown out. Before discarding food waste in the trash, weigh it and record the type, amount, and reason it’s being discarded. Get the staff or family involved in developing ideas for reducing waste.27
Tips for waste reduction at the source for restaurants:27
- Reduce batch sizes
- Use cook to order instead of bulk cooking, especially toward the end of the day
- Use as much of the food as possible (don’t peel the vegetables) and use leftovers
- Freeze surplus produce near the end of peak freshness, then use later
- Marinate meats to extend shelf life a few days
- Use see-through containers to see what is available and fresh
- Eliminate garnishes that typically don’t get eaten
University of Texas at Austin
After a food waste audit in dining halls for five days in Spring of 2008 the University of Texas at Austin found that students left an average of 5.7 oz of edible food on their plates. Staff began to work to engage and encourage students with signs to visualize their daily waste with symbolic trash cans. They began to allow students to sample menu items before choosing, and kitchen staff were trained on portion control. They continued to track pre and post consumer waste.27
A second audit was completed in Fall 2008, this time showing only 3.9 oz of edible food waste—success! But that wasn’t enough. They were able to reduce food waste by 48% by not providing trays by Fall 2009. The university continues to show a steady decline in food scraps. Between 2015 and 2016 there was an additional 18% decline, and all plate waste that remains is now being composted.28
Donate for Humans or Animals
If excess food is produced, donate it to a food bank or food rescue organization to help feed those in the community who are food insecure instead of sending it to a landfill. Nonperishable and unspoiled perishable foods can be donated, and some food rescue groups will pick up the donations free of charge. Check with the local food bank or online for organizations that can help you donate. Corporations can also receive tax benefits for their donations!29
Excess food can also be donated to farmers to feed their animals. Check with the local solid waste, agricultural extension, or public health agency for information. It is often cheaper to do this than to haul food waste to a landfill. Rutgers University and MGM Resorts International both donate food scraps from dining areas to local farms, saving significant cost on waste removal and reducing food waste.30
Industrial Uses
Another use for food waste is as a biofuel or bioproduct. Fats, oils, and grease can be collected and used as raw materials for animal food, cosmetics, soap, and other products. They can also be converted into biodiesel fuel or biogas. Several universities send their food waste to local wastewater treatment plants where it is turned into fuel that generates power for the campuses.31
Composting
Composting is another option for food waste. When organic wastes such as food, yard trimmings, and manure are combined with bulking agents such as wood chips, the wastes break down. The compost can be used as a natural fertilizer instead of using chemicals. It also can improve habitat revitalization and reforestation by improving the health of marginal or depleted soils.32 Some communities take up organic waste separately from other household wastes, usually by providing a separate waste container. The City of San Antonio Solid Waste Management Department in Texas provides a green cart for items such as food waste, food soiled paper (pizza boxes, coffee filters, etc.), yard trimmings, shredded paper and small wooden items (e.g., popsicle sticks) that is picked up from each home weekly. These items are composted, and the compost is made available for free to community members and organizations for use in gardens and landscaping. In 2020, this program diverted 70,000 tons of material from the landfill.33
Efforts at the Consumer Level
All of us can play a role in reducing food waste. The FDA34 and EPA35 have developed some tips to help consumers reduce waste, save money, and protect the environment.
At the Grocery Store or When Eating Out34
- Pre-plan and write a shopping list before going to the grocery store. Check your refrigerator and pantry to see what items you already have, and plan your eating to use those items first.
- Stick to your list and buy only what you need at the store. Shopping online and getting groceries curbside can reduce your “impulse” purchases.
- Be careful when buying items with limited shelf life in bulk. You don’t save money if you have to throw it out before it can be used.
- If available, purchase “ugly” fruits or vegetables—those with slight physical imperfections. These are safe to eat and nutritious, and can sometimes be found at a discount.
- When eating out, ask for a smaller portion to prevent waste and minimize overeating. If they do not have a smaller portion, ask for a “to go” container and take leftovers home or split a plate with a friend. You can also bring your own container to most places, minimizing the waste of the container.
In the Kitchen: Storage34,35
- Make sure the temperature setting of your refrigerator is 40° or below, and the freezer is 0° to keep foods safe.
- FDA has a FoodKeeper App containing information about how to safely store foods in the refrigerator and freezer to maintain freshness and quality.
- Refrigerate peeled or cut veggies for freshness and to keep them from spoiling.
- Freeze, preserve, or can surplus fruits and vegetables—especially abundant seasonal produce.
- Many fruits give off natural gases as they ripen, making other nearby produce spoil faster. Store bananas, apples, and tomatoes by themselves, and store fruits and vegetables in different bins.
- Create a designated space in the fridge to put items that will spoil within a few days. Make it visible, and tell your family so that these items can be eaten.
In the Kitchen: Prep34,35
- Prepare perishable foods soon after shopping. Wash, dry, chop, dice, slice, and place your fresh food items in clear storage containers for snacks and easy cooking.
- Freeze food such as bread, sliced fruit, or meat that you know you won’t be able to eat in time.
- Cut your time in the kitchen by preparing and freezing meals ahead of time.
- Prepare and cook perishable items (chicken breasts, taco meat, etc.), then freeze them in meal-sized units for use throughout the month.
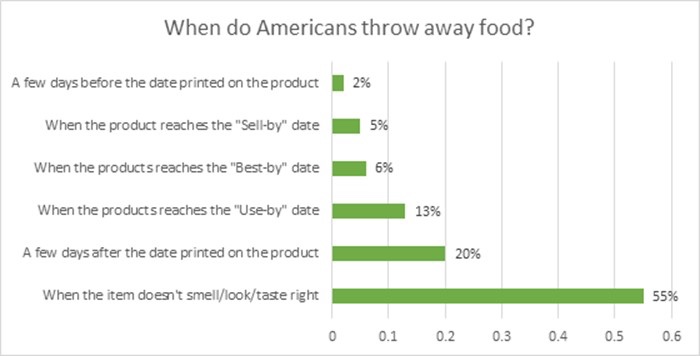
All of us have a role to play in reducing food loss and waste. Check the fridge/freezer and pantry often so that you can use what you have instead of buying something new. If you have excess food, consider donating packaged food to your local food bank or pantry. Finally, learn about date labeling. As we discussed in both Chapters 2 and 3, the only date label that pertains to food safety is the “Use By” date on infant formula. All other dates are about food quality, not safety. Only 55% of consumers say they throw away food only if it doesn’t smell, look, or taste right.36 (See Figure 10.4.2) The FDA supports efforts by the food industry to standardize phrasing, but currently date labels are applied by manufacturers at their own discretion. Confusion about date labeling contributes to about 20% of consumer food waste.34
Key Takeaways
- Around the world, nearly one billion people suffer the effects of chronic hunger.
- Key terms related to hunger include food security, which means having continual access to safe, sufficient, nutritious food, and food insecurity, which means not having continual access to safe, sufficient, nutritious food.
- There are two types of malnutrition. The first is macronutrient deficiency and relates to the lack of adequate protein, which is required for cell growth, maintenance, and repair. The second type of malnutrition is micronutrient deficiency and relates to inadequate vitamin and mineral intake.
- There are a number of groups at risk for hunger, including the unemployed and underemployed, poor families, the elderly, and the homeless. Those living in food deserts are especially vulnerable to malnutrition.
- Food deserts are geographic areas where access to affordable, healthy foods is limited or nonexistent, often because of a lack of grocery stores. Food swamps on the other hand are areas where there is an abundance of fast food and convenience stores compared to healthy food options. There is often overlap between food deserts and food swamps.
- Many governmental and non-governmental programs address hunger in the US. These include SNAP, WIC, School Lunch Program, food banks, food pantries, and Meals on Wheels.
- It is estimated that about 1/3 of our food is wasted every year, costing more than $160 billion. There are several groups working to reduce this including FAO, USDA, EPA, and FDA. Consumers can also play a role in food waste reduction.
Portions of this chapter were taken from OER Sources listed below:
Tharalson, J. (2019). Nutri300:Nutrition. https://med.libretexts.org/Courses/Sacremento_City_College/SSC%3A_Nutri_300_(Tharalson)
Additional References:
- World Hunger Education Service. (2018, May 25). 2018 World hunger, poverty facts & statistics. https://www.worldhunger.org/world-hunger-and-poverty-facts-and-statistics/#hunger-number
- Feeding America. (2020). Hunger in America. https://www.feedingamerica.org/hunger-in-america
- Coleman-Jensen, A., Rabbitt, M. P., Gregory, C. A., & Singh, A. (2019, September). Household food security in the United States in 2018. United States Department of Agriculture. Economic Research Service, ERR-270. https://www.ers.usda.gov/webdocs/publications/94849/err270_summary.pdf?v=7638.8
- Economic Research Service. (September 2019). Definitions of food security. United States Department of Agriculture. https://www.ers.usda.gov/topics/food-nutrition-assistance/food-security-in-the-us/definitions-of-food-security.aspx)
- Food and Agriculture Organization of the United Nations. (n.d.). Hunger and food insecurity. http://www.fao.org/hunger/en/
- Hodge, J. (2016). Hidden hunger: Approaches to tackling micronutrient deficiencies. In S. Gillespie, J. Hodge, S. Yosef, & R. Pandya-Lorch (Eds), Nourishing millions: Stories of change in nutrition (pp. 35-43 of chapter 4). International Food Policy Research Institute (IFPRI). http://dx.doi.org/10.2499/9780896295889_04
- Food Pantries for Thought. (2020) Urban and Rural Food Deserts. https://rampages.us/thinkingfoodpantries/poverty-and-food/urban-and-rural-food-deserts/
- Cooksey-Stowers, K., Schwartz, M. B., & Brownell, K. D. (2017). Food swamps predict obesity rates better than food deserts in the United States. International journal of environmental research and public health, 14(11), 1366. https://doi.org/10.3390/ijerph14111366
- Economic Research Service. (2009). Access to affordable and nutritious Food: Measuring and understanding food deserts and their consequences. United States Department of Agriculture. https://www.ers.usda.gov/webdocs/publications/42711/12716_ap036_1_.pdf?v=41055
- Meals on Wheels America. (n.d.). The issue. https://www.mealsonwheelsamerica.org/learn-more/the-issue
- United States Department of Housing and Urban Development. (2021, January). The 2020 Annual Homeless Assessment Report (AHAR) to Congress. Part 1: Point-in-time estimates of homelessness. https://www.huduser.gov/portal/sites/default/files/pef/2020-AHAR-Part 1.pdf
- Economic Research Service (September 9, 2020). Food security in the US-Key statistics and graphics. United States Department of Agriculture. http://www.ers.usda/gov/topics/food-nutrition-assistance/food-security-in-the-us/key-statistics-graphics.aspx
- Payne-Sturges, D. C., Tjaden, A., Caldeira, K. M., Vincent, K. B., & Arria, A. M. (2018). Student hunger on campus: Food insecurity among college students and implications for academic institutions. American Journal of Health Promotion, 32(2), 349-354. https://doi:10.1177/0890117117719620
- Goldrick-Rab, S., Richardson, J., Schneider, J., Hernandez, A., & Cady, C. (2018, April). Still hungry and homeless in college. Wisconsin HOPE lab. https://www.theotx.org/wp-content/uploads/2018/05/Wisconsin-HOPE-Lab-Still-Hungry-and-Homeless.pdf
- United States Department of Health and Human Services. (2020, January 8). Poverty guidelines. https://aspe.hhs.gov/poverty-guidelines
- United States Department of Agriculture. (2017, November). The National School Lunch Program. https://fns-prod.azureedge.net/sites/default/files/resource-files/NSLPFactSheet.pdf
- Texas Department of Agriculture. (n.d.). National School Lunch Program reimbursement rates. https://squaremeals.org/Programs/NationalSchoolLunchProgram/NSLPReimbursementRates.aspx
- United States Department of Agriculture. (n.d.). Child & Adult Care Food Program. Food and Nutrition Service. https://www.fns.usda.gov/cacfp
- United States Department of Agriculture. (n.d.). Summer Food Service Program. Food and Nutrition Service. https://www.fns.usda.gov/sfsp/summer-food-service-program
- United States Department of Health and Human Services. (n.d.). Head Start: Early Childhood and Learning Center. Administration for Children & Families. https://eclkc.ohs.acf.hhs.gov/
- Feeding America. (n.d.). What is a food bank? https://www.feedingamerica.org/our-work/food-bank-network
- San Antonio Food Bank. (n.d.). Ways to help. https://safoodbank.org/ways-to-help
- United States Department of Agriculture. (n.d.). Food waste FAQs. https://www.usda.gov/foodwaste/faqs
- Food and Agriculture Organization of the United Nations. (n.d.). Food loss and food waste. http://www.fao.org/food-loss-and-food-waste/flw-data
- Environmental Protection Agency. (n.d.). United States 2030 food loss and waste reduction goal. EPA Sustainable Management of Food. https://www.epa.gov/sustainable-management-food/united-states-2030-food-loss-and-waste-reduction-goal
- Environmental Protection Agency. (2021, January). Food recovery hierarchy. EPA Sustainable Management of Food. https://www.epa.gov/sustainable-management-food/food-recovery-hierarchy
- Environmental Protection Agency. (2021, June). How to prevent wasted food through source reduction. EPA Sustainable Management of Food. https://www.epa.gov/sustainable-management-food/how-prevent-wasted-food-through-source-reduction
- University of Texas at Austin. (2019, January). Reducing food scraps. The University of Texas At Austin Sustainability. https://www.sustainability.utexas.edu/news/reducing-food-scraps
- Environmental Protection Agency. (2021, June). Reduce wasted food by feeding hungry people. EPA Sustainable Management of Food. https://www.epa.gov/sustainable-management-food/reduce-wasted-food-feeding-hungry-people
- Environmental Protection Agency. (2021, June) Reduce wasted food by feeding animals. EPA Sustainable Management of Food. https://www.epa.gov/sustainable-management-food/reduce-wasted-food-feeding-animals
- Environmental Protection Agency. (2021, June) Industrial uses for wasted food. EPA Sustainable Management of Food. https://www.epa.gov/sustainable-management-food/industrial-uses-wasted-food
- Environmental Protection Agency. (2021, June). Reducing the impact of wasted food by feeding the soil and composting. EPA Sustainable Management of Food. https://www.epa.gov/sustainable-management-food/reducing-impact-wasted-food-feeding-soil-and-composting
- City of San Antonio. (n.d.). Organics recycling. City of San Antonio Solid Waste Management Department. https://www.sanantonio.gov/swmd/Organics
- Food and Drug Administration. (2019, November). Tips To reduce food waste. http://www.fda.gov/food/consumers/tips-reduce-food-waste
- Environmental Protection Agency. (2021, July). Wasted food at home. EPA Sustainable Management of Food. https://www.epa.gov/recycle/reducing-wasted-food-home#thriftiness
- Environmental Protection Agency. (2021, June). Food: Too good to waste implementation guide and toolkit. EPA Sustainable Management of Food. https://www.epa.gov/sustainable-management-food/food-too-good-waste-implementation-guide-and-toolkit#docs
Process of combining molecules by removing a water molecule. This occurs in many instances in the body including the building of macromolecules such as glycogen, storage fat, and protein.
