Chapter 5: Carbohydrates
“If thou tastest a crust of bread, thou tastest all the stars and all the heavens.”
-Robert Browning, English poet and playwright (May 1812–December 1889)
Carbohydrates are a very diverse group of compounds that are primarily produced by plants. Lately you have likely heard that carbs are bad for you and that you should avoid them. However, you cannot survive without them. While it’s true that some carbohydrate containing foods like highly processed foods and sugary beverages are not recommended for a healthy diet, other carbohydrate sources like whole fruits and vegetables are vital for overall good health. In this chapter we’ll look at how carbohydrates are constructed, digested, absorbed, and utilized by the body.
Learning Objectives
- Describe the different types of simple and complex carbohydrates.
- Discuss how carbohydrates are digested and absorbed in the human body.
- Summarize how blood glucose is regulated and what happens when glucose levels are not ideal.
- Describe the functions of carbohydrates in the body.
- Discuss the recommended types, amounts, and sources of carbohydrates in the diet including the AMDR, AI for fiber, and amount of added sugars.
- Describe the types, benefits, and risks of sugar alternatives.
- Summarize the long-term health implications and the dietary approaches to living with type 1 and type 2 diabetes and lactose intolerance.
5.1 Defining Carbohydrates
Carbohydrates are a group of organic compounds containing a ratio of one carbon atom to two hydrogen atoms to one oxygen atom. Basically, they are hydrated carbons. Glucose, the most abundant carbohydrate in the human body, has six carbon atoms, twelve hydrogen atoms, and six oxygen atoms. The chemical formula for glucose is written as C6H12O6. Synonymous with the term carbohydrate is the Greek word “saccharide,” which means sugar. The simplest unit of a carbohydrate is a monosaccharide. Carbohydrates are broadly classified into two subgroups, simple and complex. Simple carbohydrates are further grouped into the monosaccharides and disaccharides. Complex carbohydrates are long chains of monosaccharides called polysaccharides.
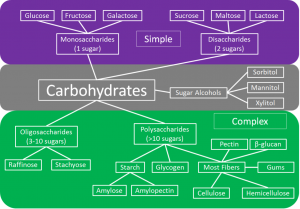
Simple Carbohydrates
Simple carbohydrates are also known simply as “sugars” and are categorized as either monosaccharides or disaccharides.
Monosaccharides
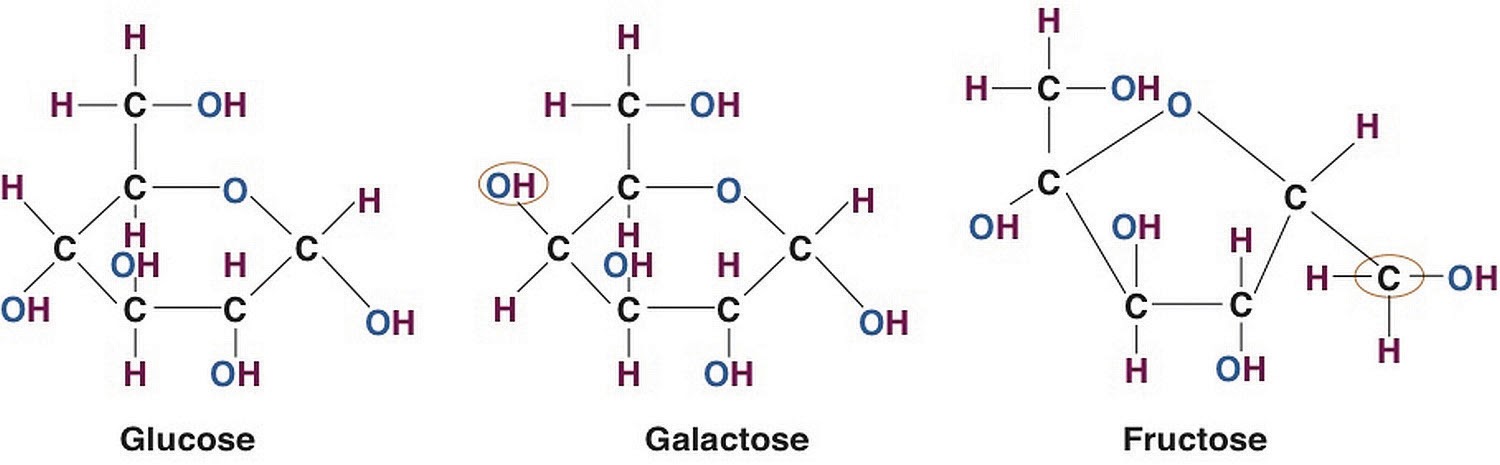
There are three monosaccharides that make up all carbohydrates—glucose, galactose, and fructose. These three monosaccharides are isomers of each other. They all have the same chemical formula, C6H12O6, but differ in the structural organization of their atoms (see Figure 5.1.2). Glucose is the preferred fuel source for all organisms from bacteria to plants to animals and the primary source of energy for every cell in the human body. The human brain is completely dependent on glucose as its energy source (except during starvation conditions).
The monosaccharide galactose differs from glucose only in that a hydroxyl (−OH) group faces a different direction on the number four carbon (see Figure 5.1.2). This small structural alteration causes galactose to be less stable than glucose. As a result, the liver rapidly converts it to glucose. Most absorbed galactose is utilized for energy production in cells after its conversion to glucose. Galactose is bound together with glucose to make up the sugar found in milk.
Fructose also has the same chemical formula as glucose but differs in its chemical structure, as the ring structure contains only five carbons and not six (see Figure 5.1.2). Fructose, in contrast to glucose, is not an energy source for other cells in the body. Mostly found in fruits, honey, and sugarcane, fructose is one of the most common monosaccharides in nature. It is also found in soft drinks, cereals, and other products sweetened with high fructose corn syrup.
Lastly, there are the sugar alcohols, which are industrially synthesized derivatives of monosaccharides. Some examples of sugar alcohols are sorbitol, xylitol, and glycerol. Xylitol is similar in sweetness to table sugar. Sugar alcohols are often used as sugar substitutes to sweeten foods as they are not completely digested and absorbed, and therefore provide fewer calories. The bacteria in your mouth attacks them, hence sugar alcohols do not cause tooth decay. Interestingly, the sensation of “coolness” that occurs when chewing gum that contains sugar alcohols comes from them dissolving in the mouth, a chemical reaction that requires heat from the inside of the mouth.
Disaccharides
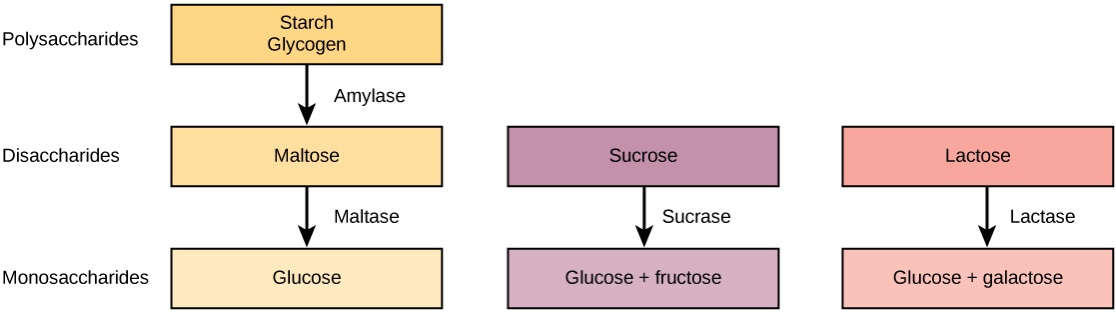
Disaccharides are composed of pairs of two monosaccharides linked together. Disaccharides include sucrose, lactose, and maltose. All of the disaccharides contain at least one glucose molecule.
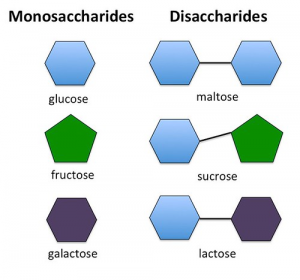
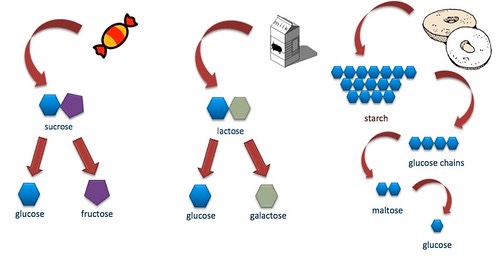
Sucrose, which contains both glucose and fructose molecules, is also known as table sugar. Sucrose is also found in many fruits and vegetables, and at high concentrations in sugar beets and sugarcane, which are used to make table sugar.
Lactose, which is commonly known as milk sugar, is composed of one glucose unit and one galactose molecule. Lactose is prevalent in dairy products such as milk, yogurt, and cheese.
Maltose consists of two glucose molecules bonded together. It is a common breakdown product of plant starches (during digestion) and is rarely found in foods as a disaccharide.
Complex Carbohydrates
Complex carbohydrates are also known as polysaccharides, long chains of monosaccharides that may be branched or not. There are three main groups of polysaccharides: starches, glycogen, and dietary fiber.
Starches
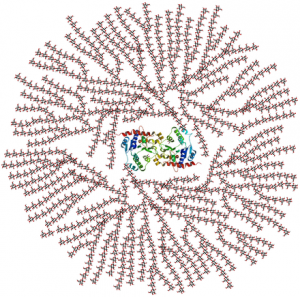
Starch molecules are found in abundance in grains, legumes, and root vegetables, such as potatoes, and is considered the stored glucose in plants. Amylose is a linear chain containing hundreds to thousands of glucose molecules. Amylopectin, another plant starch, is a branched chain containing thousands of glucose molecules. These two starch molecules (amylose and amylopectin) are contained together in foods, but amylose is more abundant.
Glycogen
Humans and animals store small amounts of glucose in the form of glycogen. It has many branches that allow it to break down quickly when energy is needed by cells in the body. It is predominantly found in liver and muscle tissue in animals. Humans consume very little glycogen, because it is rapidly broken down by enzymes in animals after slaughter.
Dietary Fiber
Dietary fibers are polysaccharides that are highly branched and cross-linked. Humans do not produce the enzymes required to break down dietary fiber; however, bacteria in the large intestine do. Dietary fiber is categorized as either water-soluble or insoluble. Some examples of soluble fibers are inulin, pectin, and guar gum and they are found in peas, beans, oats, barley, and rye. Cellulose and lignin are insoluble fibers and a few dietary sources of them are whole grain foods, flax, cauliflower, and avocados. Cellulose is the most abundant fiber in plants, making up the cell walls and providing structure. Soluble fibers are more easily accessible to bacterial enzymes in the large intestine so they can be broken down to a greater extent than insoluble fibers, but even some breakdown of cellulose and other insoluble fibers occurs.
There are several benefits to fiber consumption. Studies show that people who consume adequate or high intakes of dietary fiber appear to be at significantly lower risk of heart disease, stroke, hypertension, type 2 diabetes, obesity, and some gastrointestinal conditions such as gastroesophageal reflux disease (GERD), ulcers, diverticulosis, constipation, and hemorrhoids. It has been shown to lower blood glucose, blood pressure, and blood cholesterol levels. It slows digestion, aids in satiety which may contribute to weight loss, and adds bulk to bowel movements.1 Consuming adequate fiber may also reduce the risk of developing certain types of cancer, such as ovarian cancer.2 Fiber also serves as a prebiotic, a substance that feeds the beneficial bacteria living in the gut. With all of these significant health benefits, it is disheartening that the majority of Americans consume less than half of the recommended fiber each day. The dietary recommendation is 14 grams of fiber for every 1000 kcal consumed. Depending on biological sex and age, this amount may range from 19-38 grams per day, ideally from food sources instead of supplements.3 Dietary fiber is exclusively found in plant foods, and many are naturally high in fiber.
Table 5.1.1 Fiber in Foods4
| Food | Portion | Amount of Fiber |
| Corn Bran | 1 oz | 22 g |
| Peas (frozen, black-eyed, split) | 1 c | 14 g |
| Beans and lentils (black, pinto, navy, kidney, mung, garbanzo, lima, fava, etc.) | 1 c | 12-19 g |
| Bran (wheat or oat) | 1 oz | 12 g |
| Avocado | ½ medium | 9 g |
| Raspberries and blackberries | 1 c | 8 g |
| Edamame | 1 c | 6 g |
| Rice Bran | 1 oz | 6 g |
| Jicama | 1 c | 6 g |
| Greens (turnip, mustard, collard, spinach, kale, Swiss chard, broccoli, cauliflower, cabbage, Brussels sprouts) | 1 c | 4-6 g |
| Pears | 1 medium | 4-6 g |
| Blueberries and strawberries | 1 c | 4 g |
| Nuts (walnuts, almonds, pistachios) | 1 oz | 3-4 g |
| Other fruit (orange, banana, apple) | 1 medium | 3-4 g |
| Potato with skin (russet, sweet, red) | 1 medium | 3-4 g |
5.2 Carbohydrate Digestion and Absorption
From the Mouth to the Stomach
The mechanical and chemical digestion of carbohydrates begins in the mouth. Chewing, or mastication, crumbles the carbohydrate foods into smaller and smaller pieces. The salivary glands secrete saliva that moistens the food particles and forms a soft bolus. Saliva also contains the enzyme salivary amylase that begins to break down (or hydrolyze) amylose and amylopectin into smaller chains of glucose. Only about 5% of starch is broken down
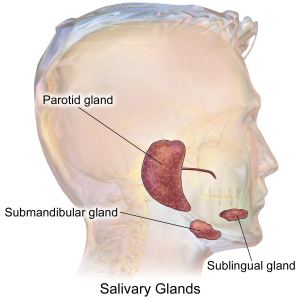
in the mouth. (This is a good thing as excess glucose in the mouth would lead to more tooth decay.) When carbohydrates reach the stomach no further chemical breakdown occurs because the amylase enzyme does not function in the acidic conditions of the stomach. But mechanical breakdown is ongoing—the strong peristaltic contractions of the stomach mix the carbohydrates into the more uniform mixture of chyme.
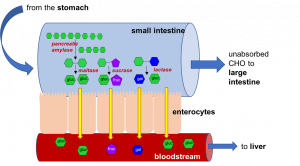
From the Stomach to the Small Intestine
The chyme is gradually expelled into the upper part of the small intestine. Upon entry of the chyme into the small intestine, the pancreas releases pancreatic juice through a small duct in the duodenum. This pancreatic juice contains the enzyme pancreatic amylase, which again starts the breakdown of starch into shorter and shorter carbohydrate chains. Additionally, enzymes are secreted by the intestinal cells that line the villi. These enzymes include sucrase, maltase, and lactase. Sucrase breaks sucrose into glucose and fructose molecules, while maltase breaks the bond between the two glucose molecules comprising maltose, and lactase breaks the bond between galactose and glucose. Once carbohydrates are chemically broken down into single sugar units (monosaccharides) they are then absorbed (or transported) into the inside of intestinal cells.
Table 5.2.1 Summary of Secretions and their Functions in Carbohydrate Digestion
| Organ | Secretion | Function |
| Salivary Glands | Saliva | Moisten and soften food |
| Salivary amylase (enzyme) | Chemical breakdown of amylose and amylopectin (starch) | |
| Stomach | Hydrochloric acid | Stops the action of salivary amylase |
| Small Intestine | Secretin (hormone) | Signals the pancreas to release secretions |
| Pancreas | Pancreatic amylase (enzyme) secreted into duodenum of small intestine | Continues breakdown of amylose and amylopectin to shorter and shorter carbohydrate chains, eventually to disaccharides |
| Bicarbonate | Neutralizes the hydrochloric acid in the chyme | |
| Intestinal villi | Sucrase (enzyme) | Breaks down sucrose into glucose + fructose |
| Maltase (enzyme) | Breaks down maltose into glucose + glucose | |
| Lactase (enzyme) | Breaks down lactose into glucose + galactose |
Food for Thought
You may have noticed that the names of the enzymes that chemically break down carbohydrates end in -ase (amylase, sucrase, maltase, lactase). This -ase ending is used almost exclusively to identify enzymes in the body. Enzymes are very specific and will only work on specific compounds or substrates. You can look at the beginning of the word to determine the specific substance that the enzyme is associated with. Amylase only helps break down amylose and amylopectin (starches), sucrase only splits sucrose, etc. So what do you think the enzyme lipase breaks down? Or protease? Or deoxyribonuclease?
Absorption into the Bloodstream
The cells in the small intestine have membranes that contain many transport proteins in order to absorb monosaccharides and other nutrients into the blood. Once absorbed they can be distributed to the rest of the body. The first organ to receive glucose, fructose, and galactose is the liver. The liver takes them up and converts galactose and fructose to glucose and either stores it as glycogen or exports it back to the blood. How much glucose the liver exports to the blood is under hormonal control and you will soon discover that even the glucose itself regulates its concentrations in the blood.
Blood Glucose Regulation
Glucose levels in the blood are tightly controlled, as having either too much or too little glucose in the blood can have negative health consequences. Glucose regulates its levels in the blood via a process called negative feedback. An everyday example of negative feedback is in your oven because it contains a thermostat. When you set the temperature to cook a delicious homemade casserole at 375°F the thermostat senses the temperature and sends an electrical signal to turn the elements on and heat up the oven. When the temperature reaches 375°F the thermostat senses the temperature and sends a signal to turn the element off. Similarly, your body senses blood glucose levels and maintains the glucose “temperature” in the target range. This glucose “thermostat” is located within the cells of the pancreas.
After eating a meal containing carbohydrates, glucose levels rise in the blood, a condition called hyperglycemia (“hyper” = high, “glyc” = glucose, “emia” = blood). Cells in the pancreas sense the increase in blood glucose and release the hormone insulin into the blood. Insulin sends a signal to the body’s cells to remove excess glucose from the blood by transporting it to the cells to be used as energy or to build storage macromolecules (such as fat). In the case of muscle and liver tissues, insulin sends the biological message to store glucose away as glycogen (glycogenesis). The presence of insulin in the blood signifies to the body that it has just been fed and to use the glucose as fuel.
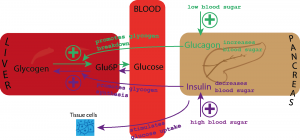
Insulin has an opposing hormone called glucagon. As the time after a meal increases, glucose levels decrease in the blood, a condition called hypoglycemia. Cells in the pancreas sense the drop in glucose and, in response, release glucagon into the blood. Glucagon communicates to the cells in the body to stop using all the glucose. More specifically, it signals the liver to break down glycogen and release the stored glucose (glycogenolysis) into the blood, so that glucose levels stay within the target range and all cells get the necessary fuel to function properly.
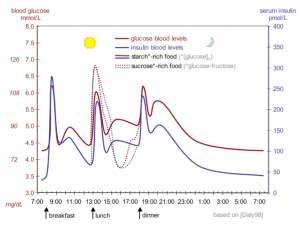
Glycemic Index and Glycemic Load
The glycemic responses of various foods have been measured and ranked in comparison to a reference food (typically a slice of white bread) to create a numeric value from 0-100 called the glycemic index. Foods with a low glycemic index do not have the potential to raise blood glucose as much or as quickly as foods with a higher glycemic index score. Diets consisting of primarily low glycemic index foods such as most vegetables, legumes, and whole grains have been shown in epidemiological and clinical trial studies to increase weight loss and reduce risk of obesity, type 2 diabetes, and cardiovascular disease.6
The carbohydrate type within a food affects the glycemic index, but so does its fat and fiber content. Increased fat and fiber in food increases the time required for digestion and delays the rate of gastric emptying into the small intestine. Processing and cooking additionally affect a food’s glycemic index by increasing its digestibility. Advancements in the technologies of food processing and the high consumer demand for convenient, precooked foods in the US have created foods that are digested and absorbed more rapidly, independent of the fiber content. Modern breakfast cereals, breads, pastas, and many prepared foods have a high glycemic index. In contrast, most raw foods have a lower glycemic index. However, the more ripened a fruit or vegetable is, the higher its glycemic index.
The glycemic index can be used as a guide to choosing healthier carbohydrate choices but has some limitations. It does not take into account the amount of carbohydrates in a portion of food, only the type of carbohydrates. For a more accurate look at glycemic responses to food, look for glycemic load which does take into account the amount of carbohydrate in addition to the glycemic index. Combining low and high glycemic index foods changes the glycemic load for the meal. Additionally, some nutrient dense foods have higher glycemic index ratings than less nutritious foods, yet a lower glycemic load. For example, watermelon has a high glycemic index (80) but there is so little carbohydrate in a serving of watermelon that the glycemic load is only 5.
Although some commercial diet plans claim to use glycemic index, worrying about glycemic index or glycemic load when planning a diet may tend to complicate things. Most dietitians and health professionals recommend focusing on consuming less processed foods and more whole foods such as vegetables, fruits, legumes, nuts, and whole grains regardless of their glycemic index or glycemic load.
From Small Intestine to Large Intestine
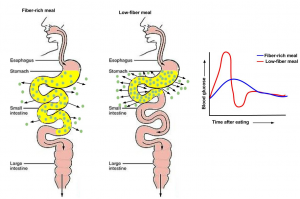
Almost all of the carbohydrates, except for dietary fiber, are efficiently digested and absorbed into the body. Some of the remaining indigestible carbohydrates are broken down by enzymes released by bacteria in the large intestine. The products of bacterial digestion of these complex carbohydrates are short chain fatty acids and some gases. The short chain fatty acids are used by the bacteria to make energy and grow, are eliminated in the feces, or are absorbed into cells of the colon, with a small amount being transported to the liver. Since dietary fiber is digested much less in the gastrointestinal tract than other carbohydrate types (simple sugars, starches) the rise in blood glucose after eating them is less and slower. These physiological attributes of high fiber foods (e.g., whole grains) are linked to a decrease in weight gain and reduced risk of chronic diseases, such as type 2 diabetes and cardiovascular disease.
5.3 Carbohydrate Functions
Energy Production
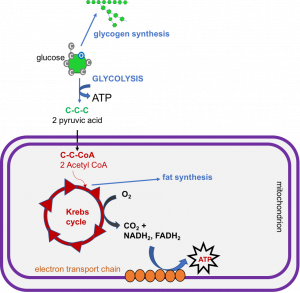
The primary role of carbohydrates is to supply energy to all cells in the body. Many cells prefer glucose as a source of energy compared to other compounds like fatty acids. Some cells, such as red blood cells, are only able to produce cellular energy from glucose. The brain is also highly sensitive to low blood glucose levels because it uses only glucose to produce energy and function (unless under starvation conditions). About 70% of the glucose entering the body from digestion is redistributed (by the liver) back into the blood for use by other tissues. Cells that require energy remove the glucose from the blood with a transport protein in their membranes. The energy from glucose comes from the chemical bonds between carbon atoms. Sunlight energy was required to produce these high energy bonds in the process of photosynthesis. Cells in our bodies break these bonds and capture the energy to perform cellular respiration.
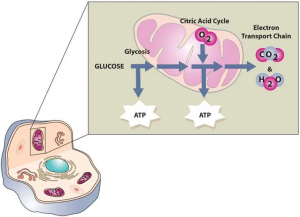
Cellular respiration requires multiple enzymatic steps to efficiently capture the energy held within the chemical bond in glucose. The first stage in the breakdown of glucose is called glycolysis, or the splitting of glucose for energy (ATP). Glycolysis is an intricate series of 10 enzymatic reaction steps occurring in the cytoplasm of the cell and without oxygen. A 6-carbon glucose molecule is split into two 3-carbon pyruvate molecules and 2 ATP are generated.
The second stage of glucose breakdown occurs within the mitochondria of the cell. The pyruvate generated during glycolysis enters the mitochondrion, where it is converted into a molecule called acetyl CoA. Acetyl CoA goes through a series of reactions called the Kreb’s Cycle (also called the Citric Acid Cycle or Tricarboxylic Acid Cycle). This cycle is aerobic and produces CO2 as a waste product. It also produces several important high energy electron carriers called NADH2 and FADH2. These high energy electron carriers go through the electron transport chain (ETC) to produce ATP for the cell.
If the cell already has enough energy, glucose from the diet can be converted into other forms for storage. In liver and muscle cells, it can be converted to glycogen (glycogenesis), but the storage area for glycogen is finite. If these storage sites are full, additional glucose can be converted to fat (lipogenesis) and stored in adipose tissue. Once converted to fat, it cannot be converted back into glucose.
When blood glucose levels fall, glucagon is released from the pancreas which stimulates glycogenolysis. If there is not enough glucose to meet the body’s needs, glucose can be synthesized from amino acids (gluconeogenesis). Both glycogenolysis and gluconeogenesis are important mechanisms for maintaining blood glucose levels to fuel the brain when carbohydrate is limited.
If carbohydrate supply is limited for extended periods such as during fasting, starvation, or consuming a very low carbohydrate diet, glycogen supplies will become depleted within about 24 hours. How will you maintain energy levels, especially to feed the brain? You will have to use the other two macronutrients. You will continue to make glucose from amino acids via gluconeogenesis which are then used to make acetyl CoA. However, if a person is starving or has severely limited dietary intake, this process requires the destruction of protein, primarily from muscle tissue. Therefore, the presence of adequate glucose spares proteins (muscle) in the body from being broken down to make glucose needed by the body.
You can also break down fat as a source of energy, but you cannot use it to make glucose. Instead, fatty acids are catabolized to acetyl CoA in the liver, which can go through the Kreb’s cycle and ETC to produce ATP. But if carbohydrate is limited, the Kreb’s cycle gets overwhelmed. In this case, acetyl CoA is converted to compounds called ketones or ketone bodies. These can then be exported to other cells in the body and used for energy. Even the brain can adapt to using ketones as a source of fuel after about three days of starvation or very low carbohydrate intake. This also helps to preserve the protein in muscle. These ketones can be excreted in the urine, but if ketone production is very high, they begin to accumulate in the blood, a condition called ketosis. Symptoms of ketosis include sweet-smelling breath, dry mouth, and reduced appetite. The minimum amount of carbohydrate in the diet required to inhibit ketosis in adults is about 50 grams per day.
Ketogenic Diets
Recently ketogenic diets have been touted as a great way to lose weight, but these types of diets are not new. They have been used for almost 100 years to treat epilepsy in children. This type of diet was also popularized in the 1970s in the low-carb Atkins diet. These diets cause ketosis because of the lack of carbohydrate. They tend to be very high in fat and moderate in protein and typically include meat, eggs, fish, nuts, butter, oils, seeds, and fibrous vegetables. Are these types of diets healthy? In the short term, many people lose weight more quickly on these diets than on a more traditional low-fat or Mediterranean style diet. However, research shows that the difference in weight loss disappears over time. Because of the restrictive nature of the high-fat, low-carb diets they can be difficult to follow long term (most people only follow the diet for a few weeks or months), and the diet can be high in animal products and sodium both of which are associated with poor health outcomes. And rapid weight loss followed by regain (yo-yo dieting) has been associated with increased mortality. Instead of following the latest diet craze, health professionals recommend making changes to the diet that are sustainable. Try for a diet that is rich in colorful fruits and vegetables, lean meats and fish, whole grains, nuts, seeds, and water.7
While insulin and glucagon are primarily responsible for blood glucose regulation, another hormone, adrenaline (or epinephrine) can also act on blood glucose. When faced with stressors, the body may enter a “fight or flight” response that requires rapid energy to either fight a potential aggressor or flee the situation. When stimulated, adrenaline is released from the adrenal glands which causes glycogenolysis or the breakdown of glycogen to glucose in the liver and muscle. It also causes an increase in heart rate and blood pressure, expands air passages in the lungs, dilates the pupils of the eyes, and redistributes blood to muscles.
Building Macromolecules
Although most absorbed glucose is used to make energy, some glucose is converted to ribose and deoxyribose, which are essential building blocks of important macromolecules, such as RNA and DNA. Glucose is additionally utilized to make the molecule NADPH, which is important for protection against oxidative stress and is used in many other chemical reactions in the body.
Energy Storage
As discussed previously, if the body already has enough energy to support its functions, excess glucose molecules are combined by a process called condensation or dehydration synthesis, creating glycogen which is stored in the muscle and liver. A molecule of glycogen may contain in excess of 50,000 single glucose units and is highly branched, allowing for the rapid dissemination of glucose when it is needed to make cellular energy. The amount of glycogen in the body at any one time is equivalent to about 4,000 kcal (3,000 in the muscle, 1,000 in the liver). Prolonged muscle use (such as exercise for longer than a few hours) can deplete the glycogen energy reserve. The weakening of muscle sets in because it takes longer to transform the chemical energy in fatty acids and proteins to usable energy than it does glucose. After prolonged exercise, glycogen is gone and muscle must rely on lipids and proteins as energy sources.
Athletes can increase their glycogen reserve modestly by reducing training intensity and increasing their carbohydrate intake to between 60-70% of total kcal 3 to 5 days prior to an event, a process called glycogen supercompensation or “carb loading.” People who are recreational exercisers and choose to run a 5-kilometer race for fun do not need to consume a big plate of pasta prior to a race since without long term intense training the adaptation of increased muscle glycogen will not happen. This will be discussed further in Chapter 12, Nutrition and Fitness.
The liver, like muscle, can store glucose energy as glycogen. While muscle will reserve all of its glycogen for its own use, the liver will sacrifice its stored glucose energy, freely sharing it with other tissues in the body when blood glucose is low. Approximately one-quarter of total body glycogen content is in the liver (equivalent to a 4-hour supply of glucose) but this is highly dependent on activity level. The liver uses this glycogen reserve as a way to keep blood glucose levels within a narrow range between meal times (recall the function of the hormone glucagon in the previous section). When the liver’s glycogen supply is exhausted, glucose is made from amino acids obtained from the destruction of proteins in order to maintain metabolic homeostasis.
If all of the energy, glycogen storing capacity, and building needs of the body are met, excess glucose is used to make fat. This is why a diet too high in carbohydrates and calories can lead to increased fat on the body.
Table 5.3.1 Functions of Select Carbohydrate Related Hormones
| Hormone | When Secreted | Function |
| Insulin | Hyperglycemia | Glycolysis: Use of glucose for energy |
| Glycogenesis: Storage of glucose as glycogen | ||
| Lipogenesis: Storage of glucose as lipid | ||
| Glucagon | Hypoglycemia | Glycogenolysis: Breakdown of glycogen for glucose for use in glycolysis |
| Gluconeogenesis: Creation of glucose from proteins | ||
| Adrenaline (Epinephrine) | Fight or flight | Glycogenolysis |
| Gluconeogenesis |
5.4 Carbohydrates, Diet, and Personal Choices
In this chapter, you have learned about the different types of carbohydrates, and the roles they play in the human body. Now that we know the benefits of eating healthy carbohydrates such as vegetables, whole fruits, and whole grains, we will examine exactly how much should be eaten to promote health and prevent disease.
How Much Do You Need?
The Food and Nutrition Board of the National Academy of Medicine (NAM) has set the carbohydrate RDA for children and adults at 130 grams per day. This is the average minimum amount the brain requires to function optimally. The AMDR for carbohydrates is 45-65%. This means that on a 2,000 kcal diet, a person should consume 225-325 grams of carbohydrate each day. The 2020-2025 Dietary Guidelines for Americans and World Health Organization (WHO) recommend consuming no more than 10% of your total kcal from added sugar. The NAM has also set the AI for dietary fiber at 38 and 25 grams for men and women, respectively. The recommendations for dietary fiber are based upon the intake levels known to prevent cardiovascular disease.
Food for Thought
Are you getting the recommended amount of dietary fiber in your diet? What are some ways you could increase your dietary fiber intake?
Dietary Sources of Carbohydrates
Carbohydrates are found within four of the five food groups of ChooseMyPlate: grains, fruits, vegetables, and dairy. Keep in mind that when beans contribute to the protein food group, they also provide carbohydrates. Simple carbohydrates are more prevalent in fruits, fruit juices, and dairy products, while complex carbohydrates are more plentiful in starchy vegetables, beans, and whole grains. Simple carbohydrates are also found in large amounts in processed foods, soft drinks, and sweets. On average, a serving of fruits, whole grains, or starches contains 15 g of carbohydrates. A serving of dairy contains about 12 g of carbohydrates, and a serving of vegetables contains about 5 g of carbohydrates.
In choosing dietary sources of carbohydrates the best ones are those that are nutrient dense, meaning they contain more essential nutrients per kcal. In general, nutrient dense carbohydrates are minimally processed and include whole grain breads and cereals, low-fat dairy products, fruits, vegetables, and beans. In contrast, energy dense carbohydrate foods are highly processed and often contain added sugars and fats. Soft drinks, cakes, cookies, and candy are examples of energy dense carbohydrates that should be minimized within one’s diet.
Whole Grains
While excessive consumption of simple carbohydrates has negative implications for your health, consuming more complex carbohydrates is extremely beneficial to health. There is a wealth of scientific evidence showing that the replacement of refined grains (highly processed) with whole grains decreases the risk for obesity, type 2 diabetes, and cardiovascular disease.
Whole grains are great dietary sources of fiber, vitamins, minerals, healthy fats, and a vast amount of beneficial phytochemicals, all of which contribute to the effects of whole grains on health. Americans typically do not consume the recommended amount of whole grains, which is 50% or more of one’s total grain intake. Diets high in whole grains have repeatedly been shown to decrease weight and risk of disease. A large group of studies all support that consuming more than two servings of whole grains per day reduces one’s chances of getting type 2 diabetes by 21%.8 The Nurses’ Health Study found that women who consumed two to three servings of whole grain products daily were 30% less likely to have a heart attack.9 The American Heart Association (AHA) makes the following statements on whole grains:
- Dietary fiber from whole grains, as part of an overall healthy diet, helps reduce blood cholesterol levels and may lower risk of heart disease.
- Fiber-containing foods help provide a feeling of fullness with fewer calories and may help with weight management.
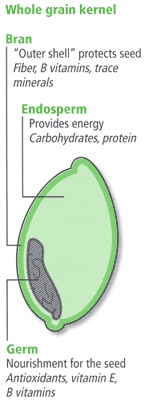
So what is a whole grain? A whole grain contains the entire grain: the bran, germ, and endosperm. All grains start out this way. Refined grains have been milled (ground into flour or meal) which removes the bran and germ. This gives them a finer texture and improves shelf life, but strips the grain of several B vitamins, iron, and fiber. As a result, refined grains are often enriched, which means that some of the B vitamins and iron are added back in, but usually not the fiber. How can you tell whether a food is a source of whole grain? Review the Nutrition Facts Label (NFL) and specifically the ingredients list. For most whole grains products, you will see the words “whole” or “whole grain” first on the ingredient list, and you may find 100% whole on the label. Other common whole grain foods include whole wheat, oatmeal, whole oats, brown rice, wild rice, popcorn, whole grain barley.10
Added Sugars
Added sugars are sugars and syrups that are added to food during preparation, processing, or at the table. According to the NAM, “major sources of added sugars include soft drinks, sports drinks, cakes, cookies, pies, fruitades (e.g., lemonade), fruit punch, dairy desserts, and candy.” Processed foods, even microwavable dinners, also contain added sugars. Added sugars do not include naturally occurring sugars in whole foods (such as an apple), but do include naturally occurring sugars such as brown sugar, honey, dextrose, fructose, fruit juice concentrates, maple syrup, and raw sugar that are then added to create other foods (such as cookies). Added sugar is also found in some less obvious places such as ketchup, salad dressings, flavored yogurt, spaghetti sauce, barbecue sauce, and breakfast cereals.
Sugar is a disaccharide—it needs very little digestion before it can be absorbed. Therefore, it raises blood glucose levels quickly, causing a massive release of insulin in order to bring blood glucose levels down. If the pancreas cannot keep up with the demand for insulin secretion, blood glucose levels stay elevated. Ultimately this can increase the risk for development of type 2 diabetes. High sugar levels also increase inflammation throughout the body, and triglycerides in the blood.12
How can you tell if a processed food contains added sugar? As you learned in Chapter 2, the new NFL identifies the amount of added sugar per serving of a product. However, you can also look at the ingredients list. There are dozens of terms that indicate there is added sugar in a product. Most items ending in “-ose” such as maltose or sucrose are sugars, although sucralose is not—we’ll discuss this further in the next section. Other ingredients to watch for include syrups, such as corn syrup or high fructose corn syrup, molasses, honey, fruit juice concentrates, and any type of sugar (cane, brown, raw, turbinado, etc).
Table 5.4.1 Common Terms Used for Added Sugars
| agave nectar | dextrose | invert sugar |
| brown sugar | evaporated cane juice | lactose |
| cane crystals | fructose | malt sugar |
| cane sugar | fruit juice concentrates | maple syrup |
| corn sweetener | glucose | molasses |
| corn syrup | high fructose corn syrup | sucrose |
| crystalline fructose | honey | turbinado sugar |
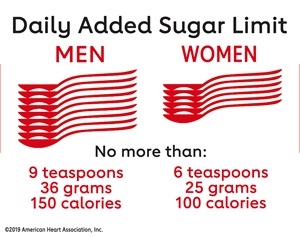
Most Americans consume significantly more sugar than is recommended. We have already discussed limiting total caloric intake from added sugars to less than 10% of your total calories, however some public health organizations like the AHA recommend an even lower intake of sugar per day—just 36g (9 tsp) for men and 25g (6 tsp) for women (see Figure 5.4.3).13 It’s easy to understand how one could easily exceed the recommendations when a single 12 oz can of soda contains 8-10 tsp of added sugar.
Food for Thought
Think about your diet. Are you consuming more than the recommended amount? What are some sources of added sugar in your diet?
Sugar Alternatives
Due to the potential health consequences of consuming too much added sugar, sugar alternatives have replaced them in many foods and beverages. These alternatives may be from natural sources or artificially made. The latter category, artificial sweeteners, must be approved by the Food and Drug Administration (FDA) for use in food and beverages. These include saccharin, aspartame, acesulfame potassium, sucralose, and neotame. Stevia is an example of a naturally derived sugar alternative. It comes from a plant and does not require FDA approval. Sugar alcohols, such as xylitol, sorbitol, erythritol, and mannitol, are carbohydrates that occur naturally in some fruits and vegetables. However, they can be industrially synthesized with yeast and other microbes for use as food additives. The FDA requires that foods disclose the fact that they contain sugar alcohols but does not require scientific testing of it though many have undergone studies anyway. In comparison to sucrose, alternative sweeteners are often at least 100 times sweeter, while sugar alcohols are often less sweet than sucrose. Alternative sweeteners are not digested or absorbed in significant amounts and therefore are not a significant source of calories in the diet, making them attractive to those who want to lose weight and/or better manage their blood glucose levels.
Benefits of Alternative Sweeteners
Consuming foods and beverages containing alternative sweeteners may benefit health by reducing consumption of simple sugars which are higher in calories, contribute to tooth decay, and are potentially linked to chronic disease when consumed in excess. Alternative sweeteners are basically non-nutrients, though not all are completely calorie or nutrient free. However, because they are so sweet, they are added in very small amounts to foods and beverages. Alternative sweeteners are not “fermentable sugars” and therefore they do not cause tooth decay. Chewing gum with alternative sweeteners is the only proven way that alternative sweeteners promote oral health. The American Dental Association (ADA) allows manufacturers of chewing gum to label packages with an ADA seal if they have convincing scientific evidence demonstrating their product either reduces plaque acids, cavities, or gum disease.
There is limited and often conflicting scientific evidence that consuming products with alternative sweeteners decreases weight. In fact, some studies suggest the intense sweetness of these products increases appetite for sweet foods and may lead to weight gain, but more research is needed. Additionally, many foods and beverages containing artificial sweeteners have little to no nutritional value and are considered empty calorie foods.
Health Concerns
The most common side effect of consuming products containing sugar alternatives is gastrointestinal upset, a result of their incomplete digestion. Since their introduction, the public has expressed concern about their safety. These health concerns related to sugar alternatives originally stemmed from scientific studies which were misinterpreted by both scientists and the public.
In the early 1970s, scientific studies were published that demonstrated that high doses of saccharin caused bladder tumors in rats. This information fueled the still ongoing debate of the health consequences of artificial sweeteners. In actuality, the results from the early studies were completely irrelevant to humans. The large doses (2.5% of their diet) of saccharin caused a pellet to form in the rat’s bladder that caused a tumor to develop. Since this study, further scientific investigations in rats, monkeys, and humans have not found any relationship between saccharin consumption and bladder (or any other type of) cancer. In 2000, saccharin was removed from the US National Toxicology Program’s list of potential carcinogens.14
There have been health concerns about other artificial sweeteners, most notably, aspartame (sold under the trade names of NutraSweet and Equal). Aspartame is accused of causing brain damage, autism, and a myriad of other disorders. The reality is there is not good scientific evidence backing up any of these accusations. In fact, aspartame has been the most scientifically tested food additive. It is approved for use as an alternative sweetener in over 90 countries. It is made by joining aspartic acid and phenylalanine (two amino acids) together. When digested it is broken down to aspartic acid, phenylalanine, and methanol. This is only problematic for people with a rare genetic disorder called phenylketonuria (PKU). People with PKU lack an enzyme causing a buildup of phenylalanine in the blood that can cause brain damage and seizures. They cannot consume phenylalanine from any source, which unfortunately greatly limits their protein intake. The FDA requires the products that contain aspartame to state on the product label: “Phenylketonurics: Contains Phenylalanine.”
Prior to introducing any new alternative sweetener into foods, it is rigorously tested and must be legally approved by the FDA. The FDA regulates alternative sweeteners along with other food additives. They are responsible for determining whether a food additive presents “a reasonable certainty of no harm” to consumers when used as proposed, otherwise known as “generally recognized as safe” (GRAS). The FDA uses the best scientific evidence available to make this statement of no harm. The FDA has also established acceptable daily intakes (ADIs) that are the maximum amount considered safe to consume daily in milligrams per kilogram body weight per day (mg/kg bw/day). Six of the more common alternative sweeteners are outlined below:15
- Saccharin:
- Discovered in 1878, oldest alternative sweetener on the market
- Brand names: Sweet’N Low®️
- Sweetness: 200-700 times sweeter than sucrose
- Product uses: General purpose sweetener in foods and beverages; heat stable and can be used when cooking
- Consumer recommendations: ADI: 5 mg/kg bw/day or the equivalent of 45 tabletop packets
- Controversial issues: Required a warning label about cancer risk in animals until 2000; no longer considered a concern. See research history above
- Aspartame:
- Brand names: Nutrasweet®️, Equal®️
- Sweetness: 200 times sweeter than sucrose
- Product uses: Beverages, gelatin desserts, gums, fruit spreads; it is not heat stable and loses sweetness when heated
- Consumer recommendations: ADI: 50 mg/kg bw/day; or the equivalent of 16 12-ounce diet soft drinks/day; or 75 tabletop packets
- Controversial issues: See above regarding research history and PKU
- Acesulfame Potassium or Acesulfame K:
- Brand names: Sunett®️, Sweet One®️
- Sweetness: 200 times sweeter than sucrose, often combined with other sweeteners
- Product uses: Chewing gum, candies, frozen desserts, beverages, baked goods; heat stable and can be used when cooking
- Consumer recommendations: ADI: 15 mg/kg bw/day; or the equivalent of 23 tabletop packets
- Controversial issues: None
- Sucralose:
- Brand names: Splenda®️
- Sweetness: 600 times sweeter than sucrose
- Product uses: General purpose sweetener; heat stable and can be used when cooking
- Consumer recommendations: ADI: 5 mg/kg bw/day or the equivalent of 23 tabletop packets
- Controversial issues: None
- Neotame:
- Approved in 2002
- Brand names: Newtame®️
- Sweetness: 7,000-13,000 times sweetener than sucrose
- Product uses: General purpose sweetener and flavor enhancer; heat stable and can be used when cooking
- Consumer recommendations: ADI: 18 mg/kg bw/day or the equivalent of 23 tabletop packets
- Controversial issues: None
- Steveioside16
- Derived from Stevia rabaudiana leaves, a plant found in South America
- Brand names: Stevia®️, Sweet Leaf®️
- Sweetness: 200-400 times sweeter than sucrose
- Product uses: Beverages, syrups; heat stable and can be used when cooking
- Consumer recommendations: ADI: 4 mg/kg bw/day; or the equivalent of 9 tabletop packets
- Controversial issues: Use of crude stevia extract are not permitted for use by FDA
- Monkfruit15
- Also known as Luo Han Guo or Swingle fruit; is a small round fruit native southern China
- Brand names: Monk Fruit in the Raw®️, Nectresse®️, PureLo®️
- Sweetness: 150-200 times sweeter than sucrose
- Product uses: General purpose sweetener and flavor enhancer; heat stable and can be used when cooking
- Consumer recommendations: ADI: Has not yet been determined
- Controversial issues: None
Choosing Carbohydrates
While the NFL can aid in determining the amount of carbohydrate you eat, they do not help in determining whether a food is refined or not. The ingredients list provides some help in this regard. As discussed in Chapter 2, it identifies all of the foods’ ingredients in order of amount, with the most concentrated ingredient first. When choosing between two breads, pick the one that lists whole wheat flour (as opposed to wheat flour) as the first ingredient, and avoid those with other flour ingredients such as corn flour or enriched white flour. Eat fewer products that contain high fructose corn syrup and other sugars (sucrose, dextrose, etc) in the first five ingredients. If you want to eat less processed foods in general, stay away from products with long ingredient lists. On the front of food and beverage labels, the manufacturer may include claims such as “sugar free” or “high fiber” (see Table 5.4.2). As discussed in Chapter 2, these nutrient content claims are FDA approved.
Table 5.4.2 Food Label Claims Pertaining to Carbohydrates
| Label Claim | Definition |
| Sugar-free | Contains less than 0.5 g sugar per serving |
| Reduced sugar | Contains 25% less sugar than similar product |
| No sugar added | No sugars added during processing |
| High fiber or Excellent source of fiber | Contains at least 20% of the DV of fiber per serving |
| A good source of fiber | Contains 10-19% of the DV of fiber per serving |
Carbohydrates are in most foods so you have a great variety of choices with which to meet the recommended amount of carbohydrates for a healthy diet. The Dietary Guidelines recommend eating more whole grains, fiber, and limiting foods high in added sugar. To do this:
- Get more daily carbohydrate servings from whole grains by eating a whole grain cereal for breakfast or using whole grain bread to make a sandwich for lunch.
- Make sure to get at least three servings (or more) of the grains you eat as whole grains every day. A serving of whole grains is equal to one slice of 100% whole wheat bread, one oz of whole grain cereal, and a half cup of cooked cereal, brown rice, or whole grain pasta.
- Food products made with cornmeal use the whole grain so choose corn tortillas, corn cereals, and corn breads with cornmeal listed as the first ingredient.
- When baking, substitute whole wheat flour or other whole grain flour for half or more of the refined white flour.
- Add beans, nuts, or seeds to salad—they add texture and taste.
- Eat snacks high in fiber such as almonds, pistachios, raisins, and air popped popcorn.
- Treat your “sweet tooth” with berries or an apple.
- Replace sugary soft drinks with seltzer water or tea (unsweetened or sweetened with alternative sugars).
5.5 Diseases and Conditions Involving Carbohydrate
Diabetes
Diabetes is a disease that occurs when one’s body does not make enough insulin or the body’s cells stop responding to insulin causing there to be too much glucose in the blood. This can lead to very serious health problems.
Diagnosing Diabetes
How do you know if you have diabetes? Diagnosis of diabetes involves checking blood levels of glucose. There are a number of ways to check your levels. Your doctor can check your fasted (nothing to eat or drink within 8 to 12 hours prior to the test) blood levels to determine your fasted blood glucose (BG) level. While this is a common lab assessment, a single test like this will not be enough for a diagnosis. If your fasted BG is high, you may be referred for additional testing.
Another common test, especially for diagnosis of gestational diabetes, is the Oral Glucose Tolerance Test (OGTT). For this test you will fast for at least 8 hours (usually overnight). When you arrive at the clinic or lab, a blood sample will be taken to measure your BG. Then you drink approximately 8 oz of a syrupy glucose solution containing 75 g of sugar. Your blood is then tested at specific intervals for 1-3 hours after. You must remain in the lab or clinic throughout this period. Your BG levels at various intervals following sugar ingestion will indicate how well your body reacts to the intake of carbohydrate. BG levels should fall at a known rate after the ingestion of the 75 g of sugar. If BG levels do not fall at this rate, but remain elevated at each interval, you may be diagnosed with prediabetes or type 2 diabetes, depending on the BG levels.
Another laboratory test that can be used looks at your glycosylated hemoglobin A1c (or Hgb A1c) level. Hemoglobin is the protein in red blood cells that carries oxygen. When blood glucose circulates, some of it can “stick” to the hemoglobin molecules. Once stuck, it cannot be removed so remains attached for the lifetime of the red blood cell which is approximately 120 days. This is a blood test that does not require fasting and provides an average blood glucose level from the past 2 to 3 months. It measures the percentage of blood glucose attached to hemoglobin, and is the most commonly used test to diagnose diabetes in clinical settings.
Table 5.5.1 Fasted Blood Glucose and Hgb A1c Levels
| Fasted Blood Glucose | Hgb A1c | |
| Healthy | 70-99 mg/dL | < 5.7% |
| Prediabetic | 100-125 mg/dL | 5.7-6.4% |
| Diabetic | > 126 mg/dL | > 6.5% |
The American Diabetes Association recommends that the following people be screened for diabetes at least every three years:17
- Those with a body mass index (BMI) higher than 25 kg/m2 and additional risk factors such as high blood pressure, elevated blood cholesterol levels, sedentary lifestyle, history of polycystic ovarian syndrome, cardiovascular disease, or a close relative with diabetes
- Anyone over the age of 45
- Any woman who has had gestational diabetes
- Anyone who has been diagnosed with prediabetes
Type 1
Type 1 diabetes (T1D) is a metabolic disease in which insulin secreting cells in the pancreas called beta cells are attacked and damaged by the body’s own immune system, causing a lack of insulin production in the body. Its onset is typically before the age of 30, although like other autoimmune diseases, it can happen at any age. There is unfortunately no way to prevent T1D. The only way to prevent the deadly symptoms of T1D is to take insulin. Before this treatment was discovered in 1921, people with T1D died rapidly after disease onset. Extremely high blood glucose levels affected brain function, leading to a coma and death.
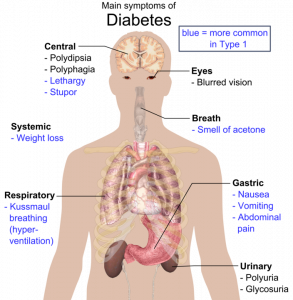
A person with T1D usually has a rapid onset of symptoms that include the three Ps—increased hunger (polyphagia), excessive thirst (polydipsia), frequent urination (polyuria), and rapid weight loss (see Figure 5.5.2). Because the main function of glucose is to provide energy for the body, when insulin is no longer present there is no message sent to cells to take up glucose from the blood. Instead, cells use fat and proteins to make energy, resulting in weight loss. If T1D goes untreated, individuals will develop a life-threatening condition called ketoacidosis. This condition occurs when the body uses fats and not glucose to make energy, resulting in a build up of ketone bodies in the blood. Symptoms of ketoacidosis include vomiting, dehydration, rapid breathing, and confusion. Breath can smell like acetone (similar to alcohol), and in extreme cases ketoacidosis can lead to a coma and death. (Ketoacidosis can also occur in type 2 diabetes but this is much less common.)
The only treatment for T1D is insulin. It can be injected into the body several times daily or can be administered via an insulin pump. Unfortunately, this is not considered a cure. People with T1D must also adhere to a diet to prevent the development of serious complications. They are often advised to consume lower glycemic index foods to prevent rapid glucose spikes, and to eat small meals frequently. They should check their blood glucose levels several times a day to ensure that their food intake and insulin are balanced. These guidelines are aimed at preventing large fluctuations in blood glucose. T1D accounts for 5 to 10% of all diabetes cases.
Insulin: The Miracle Drug
Before 1922 it was unusual for a person with T1D to live longer than 1 to 2 years. Children with T1D experienced high levels of blood glucose that often put them into comas, and these children spent days or weeks in hospital wards waiting to die. Sir Frederick G. Banting, John J. R. MacLeod, and Charles H. Best from the University of Toronto discovered insulin in 1921, and figured out how to extract it from a dog’s pancreas. The first treatment of T1D occurred on January 11, 1922 and it was injected into a 14 year old boy who was dying in a hospital in Toronto. The first injection was unsuccessful because the insulin was impure. But James B. Collip worked over the next 12 days to purify the insulin. The second injection on January 23 was successful, reversing the hyperglycemia with no negative side effects. Over the next few days, the scientists went through the hospital wards, giving injections to all those dying of T1D. Within 24 hours, these patients (mostly children) were awakening from comas. The discovery of insulin is considered one of the greatest medical achievements of all time. The four scientists shared the Nobel Prize in Medicine in 1923.18
Type 2
The other 90-95% of diabetes cases are type 2 diabetes (T2D). T2D is a metabolic disease of insulin resistance caused by muscle, liver, and fat cells no longer responding to insulin in the body, resulting in a build up of glucose in the blood. The most common risk factor for T2D is obesity. Other risk factors include consuming a diet high in simple carbohydrates and saturated fat, living a sedentary lifestyle, and having a family history of T2D.
In contrast to T1D, the onset of symptoms in T2D is more gradual and less noticeable, however, the symptoms are similar, including the three Ps (polyphagia, polydipsia, polyuria) and unexplained weight loss (see Figure 5.5.2). The first stage of T2D is characterized by high blood glucose and high insulin levels. This is because the insulin secreting cells of the pancreas attempt to compensate for insulin resistance by making more insulin. Eventually, the insulin secreting cells of the pancreas may become exhausted and no longer function. At this point, T2D must also be treated with insulin injections. There are several medications that can be prescribed for those with T2D. Some of these medications inhibit production and release of glucose from the liver, improve insulin sensitivity, or stimulate the production of more insulin. However, it is particularly important for those with T2D to eat a healthy diet, increase physical activity levels, and lose weight if they need to.
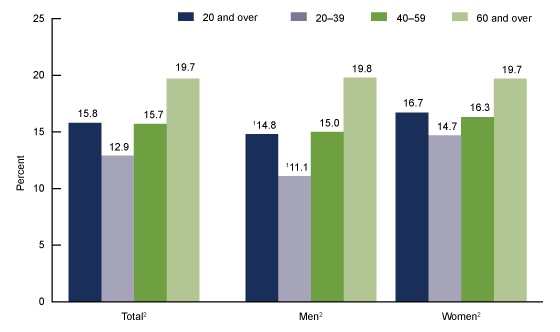
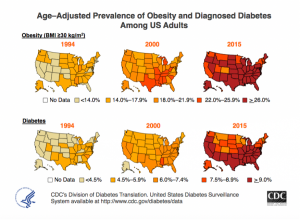
As of 2018, 34.2 million Americans, or 10.5% of the population had diabetes.19 The incidence of T2D has more than doubled in American in the past 30 years and the rise is partly attributed to the increase in obesity in this country (see Figure 5.5.1). Genetics, environment, nutrition, and lifestyle all play a role in determining a person’s risk for T2D.
We have the power to change some of the determinants of disease but not others. The Diabetes Prevention Trial studied lifestyle and drug interventions in more than 3,000 participants who were at high risk for T2D and found that intensive lifestyle intervention (weight loss and exercise) reduced the chances of getting T2D by 58%.20
Gestational
During pregnancy some women develop gestational diabetes. Physiologically speaking, gestational diabetes is similar to T2D causing insulin resistance. The exact cause is unknown but does involve the effects of pregnancy hormones on how cells respond to insulin. Gestational diabetes can cause pregnancy complications and it is common practice for pregnant women to be screened between 24 and 28 weeks of gestation. Gestational diabetes typically ends once the pregnancy does, however these women have a 50% chance of eventually developing T2D. There is also increased risk that the baby will be larger than average (9+ lb) which can make delivery more difficult and/or cause the baby to be born prematurely.21
Prediabetes
Prediabetes is a metabolic condition in which people have moderately high glucose levels, but do not meet the criteria for diagnosis as having T2D. As of 2018, approximately 88 million Americans or 34.5% of the population had prediabetes.18 Having prediabetes puts you at a much higher risk of developing T2D. You can reduce this risk by losing a small amount of weight (if overweight or obese) and becoming more physically active. A small amount of weight loss refers to 5-7% of body weight, which is only 10-14 lb in a 200 lb person. Regular physical activity refers to getting at least 150 minutes per week of aerobic moderate activity. That is the equivalent of a 30 minute brisk walk five days a week.22 Without lifestyle modifications, a prediabetic will almost always eventually develop T2D.
Diabetes Risk Factors vs. Signs and Symptoms vs. Health Consequences
When thinking about a disease such as diabetes, the terminology can get complicated. As discussed in Chapter 1, there is a difference between risk factors for and symptoms of diseases. For T2DM the risk factors include having a family history of diabetes, being overweight or obese, living a sedentary lifestyle, and consuming a diet high in refined carbohydrates, and saturated fats, and low in fiber. The more of these factors you have the more likely it is that you will develop diabetes. Once you develop the condition you experience signs and symptoms that indicate that you should be screened for the disease. These symptoms include the three Ps (polyphagia, polydipsia, polyuria), blurred vision, sores that heal slowly or not at all, glucose in the urine (glycosuria), and unexplained weight loss. Once you are diagnosed, it is up to you to try to maintain blood glucose levels within normal ranges by taking any prescribed medications, increasing physical activity if you are able, modifying your dietary intake, and losing weight. This will help you avoid negative health consequences of the disease.
Long-Term Health Consequences
If a person diagnosed with any form of diabetes works hard to maintain blood glucose levels close to the normal range, complications can be minimal. However, the long term health consequences of poorly controlled diabetes are severe. They are the result of chronically high glucose concentration in the blood accompanied by other metabolic abnormalities such as high blood lipid levels. People with diabetes are two to four times more likely to die from cardiovascular disease. Diabetes is the number one cause of new cases of blindness, lower limb amputations, and kidney failure. Many people with diabetes develop peripheral neuropathy, characterized by muscle weakness, loss of feeling, and/or pain in the lower extremities. More recently there is scientific evidence suggesting people with diabetes are also at increased risk of Alzheimer’s disease.
Treatment
Those with T1D must begin insulin injections as soon as they are diagnosed. Those with T2D typically require oral medications and some may require insulin as well. The symptoms of hyperglycemia in T2D such as the three Ps are difficult to recognize, diminish over the course of diabetes, and are often not apparent until glucose levels become very high. Having very low levels of blood glucose (hypoglycemia) is also detrimental to health. Bouts of hypoglycemia are more common in T1D and are often caused by injecting too much insulin or at the wrong time. Symptoms are more acute and include shakiness, sweating, nausea, fatigue, confusion, irritability, stupor, seizures, and coma. Hypoglycemia can be rapidly and simply treated by eating or drinking foods containing 10-20 g of simple carbohydrates (e.g., 4-6 oz fruit juice or non-diet soda).
Keeping blood glucose levels in the target range (70-130 mg/dL before meal) requires careful monitoring with a glucometer, strict adherence to a healthy diet, and increased physical activity for those with any type of diabetes. These lifestyle changes are particularly important for those with T2D. The Diabetes Prevention Trial demonstrated that by adhering to a diet containing 1,200-1,800 kcal a day with a dietary fat intake goal of less than 25% and increasing physical activity to at least 150 minutes per week, people at high risk for T2D achieved a weight loss of 7% and significantly decreased their chances of developing T2D.20
The American Diabetes Association website has a plethora of information and tips for helping those with diabetes make informed decisions about what to eat and how to keep blood glucose levels within the target range. Visit https://www.diabetes.org/nutrition to learn more.
An unfortunate problem is that many of those with diabetes do not adhere to lifestyle interventions long term. This is partly because of individual disinclination, but is also because health insurance companies do not provide continued financial support for dietary guidance and because primary care physicians often do not prescribe dietary guidance from a registered dietitian. This shifts the way diabetes is treated away from lifestyle intervention toward medications, as the goal still remains to manage blood glucose levels.
Lactose Intolerance
When people do not have enough of the enzyme lactase, lactose is not sufficiently broken down resulting in a condition called lactose intolerance. The undigested lactose moves to the large intestine where bacteria are able to digest it. The bacterial digestion of lactose produces gases leading to symptoms of abdominal cramping, bloating, and diarrhea.
Lactose intolerance is more common in adults and certain ethnicities including African Americans, Hispanic Americans, Native Americans, and Asian Americans. Those of northern European descent are least likely to develop lactose intolerance.
Most people with lactose intolerance can tolerate some amount of dairy products in their diet, especially those where the lactose is already partially digested such as yogurt and some cheeses. The severity of the symptoms depends on how much lactose is consumed and the degree of lactase deficiency.5 Those with lactose intolerance can purchase lactose free items or supplemental lactase enzymes that can be taken with food containing lactose to prevent these symptoms.
Key Takeaways
- Simple carbohydrates are sugars including the monosaccharides and disaccharides. Complex carbohydrates include the polysaccharides: starch glycogen, and dietary fiber.
- Glucose is the most important monosaccharide in human nutrition. Many other monosaccharides and disaccharides get converted to glucose in the body.
- There are numerous benefits of fiber in the diet including decreased risk of some gastrointestinal diseases, lower blood glucose and cholesterol levels, slowed digestion and increased satiety. Consumption of fiber-rich foods are scientifically proven to reduce the risk of obesity and diabetes.
- Carbohydrate digestion begins in the mouth with the mechanical action of chewing and the chemical action of salivary amylase. Carbohydrates are not chemically broken down in the stomach, but rather in the small intestine. Pancreatic amylase and the digestive enzymes secreted from intestinal villi finish the chemical breakdown of digestible carbohydrates.
- Some of the indigestible carbohydrates (fiber) are prebiotics that can be digested by bacteria in the large intestine.
- Not all carbohydrates have the same effect on blood glucose levels. The glycemic response is a measurement of the effects of a carbohydrate containing food on blood glucose levels.
- The main function of carbohydrate in the body is to provide energy. This can be achieved via cellular respiration. If glucose is not available, it can be made from amino acids. Continued lack of dietary carbohydrate can cause ketosis.
- Whole grain dietary sources stimulate weight loss and reduce disease risk. Excessive high fructose consumption has been shown to cause weight gain. A primary source of added sugars in the American diet is sugary soft drinks.
- While excessive consumption of simple carbohydrates and refined grains is potentially bad for your health, consuming whole grains made up of nutrient dense carbohydrates is extremely beneficial to health.
- Sugar alternatives include both artificial and naturally occurring substances and are safe for consumption by the general public. They are not digested or absorbed by the body and therefore do not contribute to dental caries, provide calories, or affect blood sugar levels.
- T1D is a autoimmune disease resulting from damage/destruction to the insulin secreting cells in the pancreas while T2D occurs as a result of insulin resistance by cells in the body. When left untreated, both lead to elevated blood glucose levels and severe long term health consequences.
- Lactose intolerance occurs as the body stops producing adequate amounts of lactase. Symptoms include abdominal cramping, bloating, and diarrhea.
Portions of this chapter were taken from OER Sources listed below:
Callahan, A., Leonard, H., Powell, T. (2020). Nutrition: Science and Everyday Application. https://openoregon.pressbooks.pub/nutritionscience/
Jellum, L., Hitzeman, J., Krauss, M., Henderson, S., Harnden, T., Elsberry, C., & Ford, G. (2018). Principles of Nutrition Textbook, Second Edition. Nursing and Health Sciences Open Textbooks. 5. https://oer.galileo.usg.edu/health-textbooks/5
Tharalson, J. (2019). Nutri300:Nutrition. https://med.libretexts.org/Courses/Sacremento_City_College/SSC%3A_Nutri_300_(Tharalson)
Zimmerman, M., & Snow, B. (2012). An Introduction to Nutrition, v. 1.0. https://2012books.lardbucket.org/books/an-introduction-to-nutrition/
Additional References:
- Anderson, J. W., Baird, P., Davis, R. H., Jr, Ferreri, S., Knudtson, M., Koraym, A., Waters, V., & Williams, C. L. (2009). Health benefits of dietary fiber. Nutrition reviews, 67(4), 188-205. https://doi.org/10.1111/j.1753-4887.2009.00189.x
- Zheng, B., Shen, H., Han, H., Han, T., & Qin, Y. (2018). Dietary fiber intake and reduced risk of ovarian cancer: A meta-analysis. Nutrition Journal, 17(99). https://doi.org/10.1186/s12937-018-0407-1
- United States Department of Agriculture and United States Department of Health and Human Services. (2020). Dietary Guidelines for Americans, 2020-2025. (9th ed.). https://www.dietaryguidelines.gov
- Palmer, S. (2008). The top fiber-rich foods list. Today’s Dietitian, 10(7), 28. https://www.todaysdietitian.com/newarchives/063008p28.shtml
- National Institute of Diabetes, Digestive, and Kidney Diseases. (2018, February). Lactose intolerance. https://www.niddk.nih.gov/health-information/digestive-diseases/lactose-intolerance
- Brand-Miller, J., McMillan-Price, J., Steinbeck, K., & Caterson, I. (2009). Dietary glycemic index: Health implications. Journal of the American College of Nutrition, 28, 446S-49S. https://doi.org/10.1080/07315724.2009.10718110
- Campos, M. (2020, April 14). Ketogenic diet: Is the ultimate low-carb diet good for you? Harvard Health Publishing. https://www.health.harvard.edu/blog/ketogenic-diet-is-the-ultimate-low-carb-diet-good-for-you-2017072712089
- de Munter, J. S. L., Hu, F. B., Spiegelman, D., Franz, M., & van Dam, R. M. (2007). Whole grain, bran, and germ intake and risk of type 2 diabetes: A prospective cohort study and systematic review. PLoS Medicine 8,e261. doi: 10.1371/journal.med.0040261
- Liu, S., Stampfer, M. J., Hu, F. B., Giovannucci, E., Rimm, E., Manson, J. E., Hennekens, C. H., & Willett, W. C. (1999). Whole-grain consumption and risk of coronary heart disease: Results from the Nurses’ Health Study. American Journal of Clinical Nutrition, 70(3), 412-419. https://doi.org/10.1093/ajcn/70.3.412
- American Heart Association. (2016, September 20). Whole grains, refined grains, and dietary fiber. https://www.heart.org/en/healthy-living/healthy-eating/eat-smart/nutrition-basics/whole-grains-refined-grains-and-dietary-fiber
- Ahluwalia N., Herrick, K. A., Terry, A. L., & Hughes, J. P. (2019). Contribution of whole grains to total grains intake among adults aged 20 and over: United States, 2013–2016. NCHS Data Brief, no 341. Hyattsville, MD: National Center for Health Statistics. https://www.cdc.gov/nchs/products/databriefs/db341.htm
- American Heart Association. (2018, April 17). Added Sugars. https://www.heart.org/en/healthy-living/healthy-eating/eat-smart/sugar/added-sugars
- United States Food and Drug Administration. (2018, February 8). Additional information about high-intensity sweeteners permitted for use in the US. https://www.fda.gov/food/food-additives-petitions/additional-information-about-high-intensity-sweeteners-permitted-use-food-united-states
- United States Food and Drug Administration. (2014, May 19). High-intensity sweeteners. https://www.fda.gov/food/food-additives-petitions/high-intensity-sweeteners
- Ashwell, M. (2015). Stevia, nature’s zero-calorie sustainable sweetener. Nutrition Today 50(3), 129-134. doi:10.1097/NT.0000000000000094
- Mayo Clinic. (2018, August 8). Diabetes – Diagnosis and treatment. https://www.mayoclinic.org/diseases-conditions/diabetes/diagnosis-treatment/drc-20371451
- American Diabetes Association (2019, July 1). The history of a wonderful thing we call insulin. https://www.diabetes.org/blog/history-wonderful-thing-we-call-insulin
- Centers for Disease Control and Prevention. (2020, February 14). National diabetes statistics report. https://www.cdc.gov/diabetes/data/statistics/statistics-report.html
- Diabetes Prevention Program Research Group. (2002). Reduction in the incidence of type 2 diabetes with lifestyle intervention or metformin. New England Journal of Medicine, 346(6), 393-403. doi:10.1056/NEJMoa012512
- Centers for Disease Control and Prevention. (2019, May 30). Gestational diabetes. https://www.cdc.gov/diabetes/basics/gestational.html
- Centers for Disease Control and Prevention. (2020, January 8). Prediabetes – Your chance to prevent type 2 diabetes. https://www.cdc.gov/diabetes/basics/prediabetes.html
Media Attributions
- 880FE2C7-6BB5-4CAF-B7D3-8AAA23E49EF4-203×300-1
- 8E615429-FCBF-45E7-8339-63D1CC403285-300×273-1
- 86F8C9BD-FEDC-4691-9535-E914A84EA924-153×300-1
stored form of glucose in animals including humans; stored in liver and skeletal muscle
polysaccharides found in plants that are not digestible in humans due to lack of fiber-digesting enzymes
scientific word for chewing
Carbohydrate specific enzyme in saliva that begins to chemically break down amylose and amylopectin into smaller chains of glucose
partially digested food that is a semiliquid mass that leaves the stomach about a tablespoon at a time and enters the duodenum of the small intestine
Carbohydrate-digesting enzyme secreted from the pancreas into the duodenum. It picks up where salivary amylase leaves off.
Digestive enzyme secreted from small intestine villi that splits sucrose into glucose and fructose.
Digestive enzyme secreted by intestinal villi that splits maltose into glucose monosaccharides.
Digestive enzyme secreted from intestinal villi that splits lactose into glucose and galactose.
a reaction that causes the output of a system to be lessened, leading to homeostasis
A condition of high blood glucose
Hormone released by beta cells of the pancreas during hyperglycemia. Insulin transports blood glucose into body cells, removing it from the blood.
The formation of glycogen from excess glucose molecules, occurring in the liver and muscle cells
Hormone produced by alpha cells in the pancreas. It is released when blood glucose levels decrease (between meals). It signals the liver to break down it's stored glycogen to raise blood glucose.
Low blood glucose
The breakdown of glycogen to glucose for use as energy
an indicator of both the glycemic index and the actual effect on blood glucose a food will provide.
digestive enzymes released from salivary glands that begins the digestion of lipids in infants
Formation of glucose from non-carbohydrate sources such as lipids and protein
Hormone released from adrenal glands. Considered the "fight-or-flight" hormone, it promotes breakdown of glycogen to provide quick energy to primarily the brain in addition to increasing heart rate and blood pressure, expanding air passages in the lungs, and enlarging pupils in the eyes.
Process of combining molecules by removing a water molecule. This occurs in many instances in the body including the building of macromolecules such as glycogen, storage fat, and protein.
The replacement of nutrients lost when a food is processed
Sugars and/or syrups added to food during preparation, processing, or at the table.
Condition where a person does not generate enough lactase so they cannot completely digest lactose. This causes gas, bloating, diarrhea, and cramping.
