Chapter 15: Key Functions of Micronutrients (Energy Metabolism, Electrolytes & Fluid Balance)
“It’s difficult to think anything but pleasant thoughts while eating a homegrown tomato.”
-Lewis Grizzard (1946-1994), American writer and humorist
There are two common ways to teach about vitamins and minerals in a nutrition class. The traditional way is to identify and discuss each vitamin and mineral individually. However, this method leads students to learn about the micronutrients more individually instead of how they work together. For instance, it makes sense to cover calcium with vitamin D, and iron with vitamin K. We are going to cover vitamins and minerals based on their primary function rather than covering them by their solubility characteristics (fat- or water-soluble vitamins) or how they are classified (major or trace minerals). We hope that you will gain a more integrative understanding of vitamins and minerals from this approach.
This chapter will focus on the micronutrients necessary for energy metabolism and electrolytes and fluid balance.
Learning Objectives
- Describe the roles of micronutrients associated with energy metabolism.
- List common food sources for each micronutrient associated with energy metabolism, names of deficiency/toxicity conditions and their respective consequences.
- Describe the role of electrolytes in fluid balance, as well as the more specific functions, food sources, and effects of deficiency/toxicity for sodium, potassium, and chloride.
15.1 Energy Metabolism
Have you ever heard that taking vitamins will give you more energy? Or have you bought a product that claimed it could boost your energy level because it has added vitamins? Based on the knowledge that you’ve learned in this course, you know that vitamins have no calories so are not broken down in the body to provide energy. So where does the idea that vitamins give you energy come from? In this section we will provide an overview of the B vitamins and several minerals that are important in the process of energy metabolism in the body.
All of the B vitamins and several minerals play a role in energy metabolism; they are required as functional parts of enzymes involved in energy release and storage. Many enzymes don’t work optimally, or even at all, unless bound to other specific helper molecules, called coenzymes or cofactors. What’s the difference? Vitamins that bind to enzymes are referred to as coenzymes—organic molecules which are required by enzymes to catalyze a specific reaction. They assist in converting a substrate to an end product. Cofactors are the inorganic minerals that assist in these enzymatic reactions.
Coenzymes and cofactors are essential in catabolic pathways (i.e., breaking down substances) and play a role in many anabolic pathways (i.e., building substances). Table 15.1.1 lists the vitamins and minerals that participate in energy metabolism and their key functions in that process.
Table 15.1.1 Nutrients Involved in Energy Metabolism
| B Vitamins | Role in Energy Metabolism |
| Thiamin (B1) | Assists in glucose metabolism and RNA, DNA, and ATP synthesis |
| Riboflavin (B2) | Assists in glucose and fat metabolism |
| Niacin (B3) | Assists in glucose, fat, and protein metabolism |
| Pantothenic Acid (B5) | Assists in glucose, fat, and protein metabolism, cholesterol and neurotransmitter synthesis |
| B6 (Pyridoxine) | Assists in the breakdown of glycogen and synthesis of amino acids, neurotransmitters and hemoglobin |
| Biotin (B7) | Assists in amino acid synthesis and glucose, fat, and protein metabolism |
| Folate (B9) | Assists in the synthesis of amino acids, RNA, DNA, and red blood cells |
| B12 (Cobalamin) | Protects nerve cells and assists in fat and protein catabolism, folate function and red blood cell synthesis |
| Minerals | Role in Energy Metabolism |
| Iodine | Assists in metabolism, growth, development, and synthesis of thyroid hormone |
| Copper | Assists in energy and iron metabolism and neurotransmitter synthesis |
| Zinc | Assists in glucose, fat, and protein metabolism, and synthesis of DNA, RNA and protein |
| Manganese | Assists in glucose and cholesterol metabolism, bone formation, and synthesis of urea |
| Chromium | Assists in glucose, fat, and protein metabolism, DNA and RNA synthesis |
| Molybdenum | Assists in metabolism of sulfur-containing amino acids and synthesis of DNA and RNA |
| Sulfur | A component in sulfur-containing amino acids necessary in certain enzymes; a component in thiamin and biotin |
15.2 Vitamins Associated with Energy Metabolism
Recall from the previous chapter that there are eight water-soluble B vitamins with similar chemical structures and functions, designated by a number. Because B vitamins play so many important roles in energy metabolism, primarily as coenzymes, it is common to see marketing claims that B vitamins boost energy and performance. This is a myth that is not backed by science. The “feeling” of more energy from energy-boosting supplements stems more from the high amount of added sugars, caffeine, and/or other herbal stimulants that accompany the high doses of B vitamins in these products. As discussed, B vitamins are needed to support energy metabolism and growth, but taking in more than required does not supply you with more energy. A great analogy of this phenomenon is the gas in your car. Does it drive faster with a half-tank of gas or a full one? It does not matter; the car drives just as fast as long as it has gas. Similarly, depletion of B vitamins will cause problems in energy metabolism, but having more than is required does not speed it up. And because B vitamins are water-soluble, most are not stored in the body in significant amounts and the excess will be excreted, essentially flushing out the added expense of the supplements.
Thiamin (Vitamin B1)
Thiamin (also known as thiamine) or vitamin B1 was discovered in 1906.1 It acts as a coenzyme in aerobic metabolism, particularly in reactions that release carbon dioxide and is necessary for the breakdown of glucose, fatty acids, and some amino acids. It also plays a role in the synthesis of neurotransmitters, RNA and DNA.2,3
Whole grains, meat, and fish are great sources of thiamin. The US, as well as many other countries, enrich their refined grains with thiamin.
Table 15.2.1 Thiamin Content of Various Foods3
| Food | Serving | Thiamin (mg) | %DV |
| White rice, enriched | ½ c | 1.4 | 117 |
| Breakfast cereals, enriched | 1 | 1.2 | 100 |
| Egg noodles, enriched | ½ c | 0.5 | 42 |
| Pork chop, broiled | 3 oz | 0.4 | 33 |
| Black beans, boiled | ½ c | 0.4 | 33 |
| English muffin, enriched | 1 | 0.3 | 25 |
| Tuna, cooked | 3 oz | 0.2 | 17 |
| Acorn squash, baked | ½ c | 0.2 | 17 |
| Sunflower seeds, roasted | 1 oz | 0.1 | 8 |
| 2% milk | 8 oz | 0.1 | 8 |
The RDA for thiamin is 1.2 mg/day for men and 1.1 mg/day for women. There is no UL currently for thiamin, as there is no human data for adverse effects from high doses. Therefore, there is no toxicity disease or condition associated with excess thiamin consumption.3
Thiamin deficiency, also known as beriberi, can cause symptoms of fatigue, confusion, movement impairment, pain in the lower extremities, swelling and heart failure. The brain and heart are most affected by a deficiency in thiamin. It is prevalent in societies whose main dietary staple is white rice. During the processing of white rice, the bran is removed along with several nutrients (such as thiamin) that are vital for metabolism. Another common thiamin deficiency, Wernicke-Korsakoff syndrome, like beriberi, can cause similar symptoms such as confusion, loss of coordination, vision changes, hallucinations, and may progress to coma and death. This condition is most prevalent in those with severe alcoholism as alcohol inhibits thiamin absorption. Other individuals at risk include those with eating disorders, the elderly, and individuals who have undergone gastric bypass surgery.3
Riboflavin (Vitamin B2)
Riboflavin, or vitamin B2, first discovered in 1933, is an essential component of flavoproteins, which are coenzymes involved in many metabolic pathways of carbohydrate and lipid metabolism.1 Flavoproteins aid in the transfer of electrons in the electron transport chain (flavin adenine dinucleotide or FADH2). Furthemore, the functions of other B vitamin coenzymes (such as vitamin B6 and folate) are dependent on the action of flavoproteins. The “flavin” portion of riboflavin gives a bright yellow color to riboflavin, an attribute that helped lead to its discovery. When riboflavin is taken in excess as a dietary supplement, the excess will be excreted through your kidneys and appear bright yellow in your urine. Although the color may alarm you, it is harmless.
Riboflavin can be found in a variety of different foods but it is important to remember that it can be destroyed by sunlight. Milk is a good source of riboflavin. In the past, milk was packaged in glass bottles. The packaging has now changed to translucent plastic containers or cardboard to block light from destroying riboflavin in the milk.
Table 15.2.2 Riboflavin Content of Various Foods4
| Food | Serving | Riboflavin (mg) | %DV |
| Beef liver | 3 oz | 2.9 | 223 |
| Breakfast cereals, enriched | 1 c | 1.3 | 100 |
| Instant oats, fortified | 1 c | 1.1 | 85 |
| Plain yogurt, fat-free | 1 c | 0.6 | 46 |
| 2% milk | 1 c | 0.5 | 38 |
| Beef, tenderloin steak | 3 oz | 0.4 | 31 |
| Portabella mushroom, sliced | ½ c | 0.3 | 23 |
| Egg, scrambled | 1 large | 0.2 | 15 |
| Quinoa | 1 c | 0.2 | 15 |
| Spinach, raw | 1 c | 0.1 | 8 |
The RDA for riboflavin is 1.3 mg/day for men and 1.1 mg/day for women. There is no UL for riboflavin because no toxicity has been reported when an excess amount has been consumed through foods or supplements. Therefore, there is no toxicity disease or condition associated with excess riboflavin consumption.4

Riboflavin deficiency, also referred to as ariboflavinosis, is often accompanied by other dietary deficiencies (most notably protein) and can be common in people suffering from alcoholism. This deficiency will usually occur in conjunction with deficiencies of other B vitamins because the majority of B vitamins have similar food sources. Signs and symptoms of ariboflavinosis include dry, scaly skin, cracking of the lips (stomatitis) and at the corners of the mouth (cheilosis), sore throat, itchy eyes, and light sensitivity4
Niacin (Vitamin B3)
Niacin, or vitamin B3, was first discovered in 1926. Niacin was actually the first vitamin to be synthesized, back in 1867, although at that time it’s association with nutrition was unknown.1 Niacin is a component of the coenzymes NADH and NADPH, which are involved in both the catabolism and anabolism of carbohydrates, lipids, and protein. NADH is the predominant electron carrier and transfers electrons to the electron transport chain to make ATP. NADPH is also required for the anabolic pathways of fatty acid and cholesterol synthesis. In contrast to other vitamins, niacin is unique in that it can be synthesized by humans from the amino acid tryptophan in an anabolic process requiring enzymes dependent on riboflavin, vitamin B6, and iron. Niacin is made from tryptophan only after tryptophan has met all of its other needs in the body.
Niacin can be found in a variety of different foods such as yeast, meat, poultry, fish, and grains. In plants, especially mature grains, niacin can be bound to sugar molecules which can significantly decrease its’ bioavailability.
Table 15.2.3 Niacin Content of Various Foods5
| Food | Serving | Niacin (mg) | %DV |
| Chicken breast, grilled | 3 oz | 10.3 | 64 |
| Turkey breast, roasted | 3 oz | 10.0 | 63 |
| Salmon, sockeye, cooked | 3 oz | 8.6 | 54 |
| Beef (90% lean), pan browned | 3 oz | 5.8 | 36 |
| Brown rice, cooked | 1 c | 5.2 | 33 |
| Peanuts, roasted | 1 oz | 4.2 | 26 |
| Russet potato, baked | 1 medium | 2.3 | 14 |
| Bread, whole wheat | 1 slice | 1.4 | 9 |
| Banana | 1 medium | 0.8 | 5 |
| Broccoli, boiled | ½ c | 0.4 | 3 |
The RDA for niacin is 16 mg/day for men and 14 mg/day for women. The UL for niacin applies only to supplemental niacin and is 35 mg for both men and women. Consumption of 35 mg or higher is more associated with “niacin flush” where a person’s face, arms, and chest becomes a reddish color resulting from vasodilation of small blood vessels. Flushing is often accompanied by sensations of burning, tingling, and itching. These symptoms are often transient and while unpleasant, fairly harmless. However, more serious signs and symptoms include headache, rash, dizziness, and a decrease in blood pressure.5 Many pre-workout supplements contain high amounts of niacin, as much as 35 mg per serving. Some people consuming these report the flushing sensations listed above which they attribute to the supplement getting them “pumped up.” Physiologically speaking, however, these symptoms do not provide an increase in metabolism or muscle contraction.
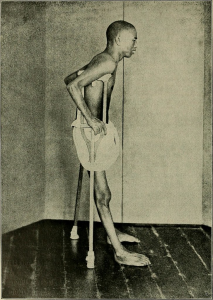
Mild niacin deficiency has been shown to cause fatigue, decreased appetite, indigestion, and decreased tolerance to cold. Severe deficiency of niacin in the diet causes the disease pellagra, which is characterized by the 4 Ds: diarrhea, dermatitis (as seen in Figure 15.2.3), dementia, and eventually death if not treated. It is considered a disease of poverty, and develops in those who are undernourished, consuming a primarily corn-based diet.
Nixtamilization
Native Americans who grew and consumed corn as a staple in their diet learned to avoid pellagra by treating their corn with alkali—soaking it in wood ashes in North America or calcium hydroxide (pickling lime) in Central and South America prior to grinding it into corn meal. This allows the niacin to become more bioavailable. This process called nixtamilization is applied to make masa harina, the corn meal used to make corn tortillas and tamales.
The War on Pellagra

Pellagra was first identified among Spanish peasants in 1735. Because of the skin lesions that developed, it was often mistaken for leprosy. In the US, cases were reported as far back as the 1820s, but pellagra was not officially identified here until 1907. In the early 20th century, pellagra was rampant, killing many poor Southerners. From 1907-1940, there were as many as 3 million cases and 100,000 deaths. Dr. Joseph Goldberger, who had been battling other epidemic diseases, was asked to head the investigation into pellagra. At that time, most doctors were convinced that pellagra was an infectious disease caused by germs. However, anecdotal evidence from mental institutions and prisons showed that inmates often contracted pellagra but staff almost never did. This led Goldberger to question the infectious disease hypothesis and instead he theorized that the disease was related to diet. To test this he had shipments of food sent to two orphanages and the Georgia State Asylum. The results were clear, once children and inmates who had pellagra were fed fresh meat, milk and vegetables instead of a corn-based diet, they recovered. Those without pellagra who ate the new diet never developed it.
Many doctors refused to believe pellagra was caused by a dietary deficiency. Goldberger hoped to convince them by injecting blood and swabbing secretions from a person with pellagra into himself and several volunteers. They also swallowed capsules containing scabs of rashes from the skin of pellagra victims. None of them got pellagra. Although the actual dietary deficiency, niacin, was not identified until after Goldberger’s death, he was honored posthumously for his selfless devotion to relieving the suffering of those with pellagra.6
Pantothenic acid (Vitamin B5)
Pantothenic acid, or vitamin B5, was first discovered in 1931.1 Pantothenic acid is required to synthesize coenzyme A (CoA) which is the carbon carrier of glucose, fatty acids, and amino acids in the Kreb’s cycle. CoA is also involved in the synthesis of lipids, cholesterol, and acetylcholine (a neurotransmitter). Pantothenic acid is widely distributed in all types of food, which is why a deficiency in this nutrient is rare. Its name derives from the Greek “pantothen,” meaning “from everywhere.”
Table 15.2.4 Pantothenic Acid Content of Various Foods7
| Food | Serving | Pantothenic Acid (mg) | %DV |
| Shiitake mushrooms, cooked | ½ c | 2.6 | 52 |
| Sunflower seeds | ¼ c | 2.4 | 48 |
| Chicken breast, roasted | 3 oz | 1.3 | 26 |
| Fresh tuna, cooked | 3 oz | 1.2 | 24 |
| Avocado | ½ large | 1.0 | 20 |
| 2% milk | 1 c | 0.9 | 18 |
| Egg, hard boiled | 1 large | 0.7 | 14 |
| Ground beef (85%), broiled | 3 oz | 0.6 | 12 |
| Whole wheat pita | 1 large | 0.5 | 10 |
| Broccoli, boiled | ½ c | 0.5 | 10 |
The RDA for pantothenic acid is 5 mg/day for men and women. There is no UL currently for pantothenic acid, as there is insufficient human data to identify adverse effects from high doses. Therefore, there is no toxicity disease or condition associated with excess pantothenic acid consumption.7
A severe pantothenic acid deficiency is exceptionally rare. Signs and symptoms include fatigue, irritability, numbness, headache, and a burning sensation of the hands and feet.7
Vitamin B6 (Pyridoxine)
Vitamin B6, first discovered in 1934, refers to a group of chemically similar compounds which can be interconverted in biological systems (pyridoxine, pyridoxamine, pyridoxic acid, etc).1 Vitamin B6 acts as a coenzyme in a wide variety of functions in the body. One major function is the nitrogen transfer between amino acids which plays a role in amino acid synthesis and catabolism, such as the conversion of the amino acid tryptophan to niacin.2 It also functions to release glucose from glycogen and is required for the synthesis of multiple neurotransmitters and hemoglobin.
Vitamin B6 can be found in a wide variety of foods. However, losses of B6 can occur during cooking, storage and processing depending on the form of the vitamin present in food. The richest sources include fish, beef liver, potatoes, and other starchy vegetables.
Table 15.2.5 Vitamin B6 Content of Various Foods8
| Food | Serving | Vitamin B6 (mg) | %DV |
| Chickpeas, canned | 1 c | 1.1 | 65 |
| Fresh tuna, cooked | 3 oz | 0.9 | 53 |
| Salmon, sockeye, cooked | 3 oz | 0.6 | 35 |
| Potatoes, boiled | 1 c | 0.4 | 25 |
| Banana | 1 medium | 0.4 | 25 |
| Ground beef (85%), broiled | 3 oz | 0.3 | 18 |
| Cottage cheese (1%) | 1 c | 0.2 | 12 |
| Squash, winter, baked | ½ c | 0.2 | 12 |
| White rice, enriched, cooked | 1 c | 0.1 | 6 |
| Watermelon | 1 c | 0.1 | 6 |
The RDA for vitamin B6 is 1.3 mg/day for men and women. The UL for vitamin B6 is 100 mg/day and this applies to both food and supplement intakes. Chronic vitamin B6 supplementation has been shown to cause severe and progressive neuropathy and loss of control of bodily movements.8
A deficiency in vitamin B6 can cause anemia, but it is a different type than that caused by insufficient folate, vitamin B12, or iron, although the symptoms are similar. The size of red blood cells is normal or somewhat smaller, but the hemoglobin content is lower. This means that each red blood cell has less capacity for carrying oxygen, resulting in muscle weakness, fatigue, and shortness of breath. Other deficiency symptoms can include dermatitis, mouth sores, and confusion.
Biotin (Vitamin B7)
Biotin, or vitamin B7, was first discovered in 1926.1 Biotin is required as a coenzyme in the Kreb’s cycle and in lipid metabolism. It is also required as an enzyme in the synthesis of glucose and some nonessential amino acids, and is widely available in dietary supplements for hair and nails. A specific enzyme, biotinidase, is required to release biotin from protein so that it can be absorbed in the gut. There is some bacterial synthesis of biotin that occurs in the colon, however this is not a significant source of biotin. Biotin can be found in foods such as eggs, fish, meat, seeds, nuts, and some vegetables.
Table 15.2.6 Biotin Content of Various Foods9
| Food | Serving | Biotin (mcg) | %DV |
| Egg, cooked | 1 large | 10.0 | 33 |
| Salmon, canned | 3 oz | 5.0 | 17 |
| Pork chop, cooked | 3 oz | 3.8 | 13 |
| Sunflower seeds | ¼ c | 2.6 | 9 |
| Sweet potato, cooked | ½ c | 2.4 | 8 |
| Almonds, roasted | ¼ c | 1.5 | 5 |
| Tuna, canned in water | 3 oz | 0.6 | 2 |
| Spinach, boiled | ½ c | 0.5 | 2 |
| Broccoli, fresh | ½ c | 0.4 | 1 |
| Banana | ½ c | 0.2 | 1 |
Because there is little information on the requirements for biotin, instead of an RDA, an AI of 30 mcg has been identified for men and women. There is no UL currently for biotin, as there is insufficient human data to identify adverse effects from high doses.9
Biotin deficiency is rare, but can be caused by eating large amounts of egg white over an extended period of time. This is because a protein in egg whites tightly binds to biotin making it unavailable for absorption. A rare genetic disease causing malfunction of the biotinidase enzyme also results in biotin deficiency.
Folic Acid (Vitamin B9)
Folic acid, or vitamin B9, was first discovered in 1931.1 Folate, a reduced form of folic acid, is a required coenzyme for the synthesis of the amino acid methionine, and for making RNA and DNA. Therefore, rapidly dividing cells are most affected by folate deficiency. Red blood cells, white blood cells, and platelets are continuously being synthesized in the bone marrow from dividing stem cells. When folate is deficient, these cells cannot divide normally. A consequence of folate deficiency is macrocytic, megaloblastic anemia. Macrocytic refers to large sized and megaloblastic refers to immature cells that contain less hemoglobin. These cells are unable to produce DNA and RNA fast enough; cells grow but do not divide making them larger in size.
Folate is found naturally in a wide variety of foods including vegetables (particularly dark green leafy vegetables), fruits, nuts, peas, dairy products and more. In fact, the term “folic” is from the Latin word folium, which means leaf. Spinach, asparagus, and Brussels sprouts are among the foods with the highest folate levels. The Food and Drug Administration (FDA) began requiring manufacturers to enrich breads, cereals, flours, and cornmeal in 1998 to increase the consumption of folate in the American diet.
Table. 15.2.7 Folate Content of Various Foods10
| Food | Serving | Folate (mcg DFE) | %DV |
| Beef liver, braised | 3 oz | 215 | 54 |
| Spinach, boiled | ½ c | 131 | 33 |
| Black eyed peas, boiled | ½ c | 105 | 26 |
| Asparagus, boiled | 4 spears | 89 | 22 |
| Brussels sprouts, boiled | ½ c | 78 | 20 |
| Spaghetti, enriched, cooked | ½ c | 74 | 19 |
| Avocado, raw | ½ c | 59 | 15 |
| Broccoli, chopped, cooked | ½ c | 52 | 13 |
| Orange juice | ¾ c | 35 | 9 |
| Egg, hard boiled | 1 large | 22 | 6 |
Folate is found naturally in foods, while folic acid is the chemical form that is used in dietary supplements as well as enriched foods, such as grains. The Food and Nutrition board of the National Academy of Medicine (NAM) developed dietary folate equivalents (DFE) to reflect the fact that folic acid is more bioavailable and easily absorbed than folate found in food. This is unique to folate—that the supplemental form is more bioavailable than what is found naturally in foods. One DFE is defined as 1 mcg of dietary folate, or 0.6 mcg of folic acid supplement.10
The RDA for folate is 400 mcg DFE/day for men and women. The UL for folate is 1,000 mcg/day and applies to supplemental intakes. Large amounts of folate can mask vitamin B12 deficiency, but not the neurological damage associated with it.10
As stated previously, folate deficiency can lead to macrocytic, megaloblastic anemia which can include the following signs and symptoms: weakness, fatigue, heart palpitations, shortness of breath, headache, and open sores on the tongue.
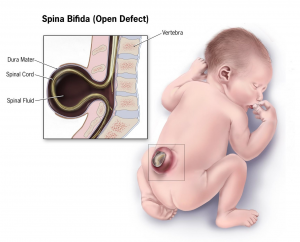
Children whose mothers were folate deficient during pregnancy have a higher risk of birth defects, such as spina bifida. This is a neural tube defect that occurs when the spine does not completely enclose the spinal cord. It can lead to many physical and mental disabilities. Results of clinical trials have demonstrated that neural tube defects are significantly decreased in the offspring of mothers who began taking folate supplements at least one month prior to becoming pregnant and throughout the pregnancy.

In extreme cases, a neural tube fatal defect called anencephaly can occur in which the cerebral hemispheres of the brain do not develop. Prenatal screening for neural tube defects has significantly decreased the number of births of infants with anencephaly, and correction of folate deficiency through enrichment of grain products has reduced the incidence even further. When there is no upper brain development, the eyes and eyelids are the topmost part of the body, giving the head a “frog-eyed” appearance. Anencephaly typically results in spontaneous abortion or stillborn birth. Infants born alive typically die within hours or days.
Vitamin B12 (Cobalamin)
Vitamin B12 was first discovered in 1926.1 This vitamin is unique in that it is the largest and most complex of the vitamins and it contains cobalt, the only vitamin that contains a metal ion.2 Vitamin B12 is an essential part of several coenzymes, necessary for fat and protein catabolism, for folate coenzyme function, and for hemoglobin synthesis. An enzyme requiring vitamin B12 is needed by a folate dependent enzyme to synthesize DNA. Thus a deficiency in vitamin B12, similar to a folate deficiency, causes macrocytic, megaloblastic anemia in children and adults, and an increased risk of neural tube defects in children born to B12 deficiency mothers.
Vitamin B12 is found naturally in animal products such as fish, meat, poultry, eggs, and milk products. Although vitamin B12 is generally not found in plant foods, fortified breakfast cereals and some nutritional yeast products may also be sources.
Table 15.2.8 Vitamin B12 Content of Various Foods11
| Food | Serving | Vitamin B12 (mcg) | %DV |
| Clams, cooked | 3 oz | 84.1 | 3,504 |
| Salmon, sockeye, cooked | 3 oz | 4.8 | 200 |
| Tuna, canned in water | 3 oz | 2.5 | 104 |
| Haddock, cooked | 3 oz | 1.8 | 75 |
| Beef, top sirloin, broiled | 3 oz | 1.4 | 58 |
| Milk (2%) | 1 c | 1.2 | 50 |
| Yogurt (2%) | 1 c | 1.1 | 46 |
| Cheese, Swiss | 1 oz | 0.9 | 38 |
| Egg, hard boiled | 1 large | 0.6 | 25 |
| Chicken breast, roasted | 3 oz | 0.3 | 13 |
The RDA for vitamin B12 is 2.4 mcg/day for men and women. Unlike most other water-soluble vitamins, B12 is stored in the liver.2 However, because of it’s low potential for toxicity, it has no UL.11
In order for the human body to absorb B12, the stomach, pancreas, and small intestine must be functioning properly. Cells in the stomach secrete a protein called intrinsic factor that is necessary for vitamin B12 absorption, which occurs in the small intestine. Impairment of intrinsic factor secretion caused by either an autoimmune disease or by chronic inflammation of the stomach (such as that occurring in some people with H. pylori infection) can lead to pernicious anemia, a type of macrocytic anemia. This is a secondary deficiency associated with lack of intrinsic factor and treatment consists of B12 injections to bypass the gastrointestinal tract. B12 deficiency is most common in the elderly who may have impaired functioning of digestive organs, a normal consequence of aging.
Vitamin B12, along with folate, play key roles in converting homocysteine to the amino acid methionine. High levels of homocysteine in the blood increase the risk for heart disease. Therefore, low levels of folate, vitamin B12, and vitamin B6 (which acts as a coenzyme in this conversion) will increase homocysteine levels therefore increasing the risk of heart disease. When there is a deficiency in vitamin B12, inactive folate (from food) is unable to be converted to active folate and used in the body for the synthesis of DNA. Folic acid (that comes from supplements or enriched foods), however, is available to be used as activated folate in the body without B12.
Choline
Choline is an organic, water-soluble substance that is not classified as a vitamin but is similar to the B vitamins. However, the synthesis of choline is limited and therefore it is recognized as an essential nutrient. Choline is necessary for the synthesis of the neurotransmitter acetylcholine, phospholipids used to make cell membranes, lipid transport, and also homocysteine metabolism.
Table. 15.2.9 Choline Content of Various Foods 12
| Food | Serving | Choline (mg) | %DV |
| Egg, hard boiled | 1 large | 147 | 27 |
| Beef, top round, braised | 3 oz | 117 | 21 |
| Soybeans, roasted | ½ c | 107 | 19 |
| Chicken breast, roasted | 3 oz | 71 | 13 |
| Shiitake mushrooms, cooked | ½ c | 58 | 11 |
| Red potatoes, baked | 1 large | 57 | 10 |
| Kidney beans, canned | ½ c | 45 | 8 |
| Milk (1%) | 1 c | 43 | 8 |
| Brussels sprouts, boiled | ½ c | 32 | 6 |
| Cottage cheese, non-fat | 1 c | 26 | 5 |
There is insufficient data on choline so the NAM recommends an AI of 550 mg/day for men and 425 mg/day for women, with a UL of 3,500 mg/day. High intakes of choline are associated with a fishy body odor, vomiting, excessive sweating and salivation, hypotension (low blood pressure), and liver toxicity.12
In addition to metabolism, B vitamins also contribute to many other body functions. They are involved in the creation of neurotransmitters, and deficiencies have been linked to some of the health consequences associated with aging including cognitive dysfunction and neurological symptoms, low bone density, and cardiovascular disease. Folate, B6, B12, and riboflavin are most commonly associated with these issues. Deficiency in an older population can be caused by inadequate intake, malabsorption (e.g., reduction in instrinsic factor production required for B12 absorption), increased requirements, drug-nutrient interactions affecting bioavailability, genetic disorders, or medical conditions. A deficiency in any of the B vitamins should be avoided as we age.13
15.3 Minerals Associated with Energy Metabolism
Iodine
Iodine is essential for the synthesis of thyroid hormone, which regulates basal metabolism, growth, and development.
The mineral content of foods is greatly affected by the soil from which it grew, and thus geographic location is the primary determinant of the mineral content of foods. For instance, iodine comes mostly from seawater so the greater the distance from the sea the lesser the iodine content in the soil. Seafood including seaweed (such as kelp, nori, kombu, and wakame) is one of the best food sources of iodine, but it is highly variable in its content. Since 1924, most salt in the US has been fortified with iodine. Iodized salt, dairy products, especially milk, and grains are the major contributors of iodine to the American diet.14
Table 15.3.1 Iodine Content of Various Foods14
| Food | Serving | Iodine (mcg) | %DV |
| Seaweed, sheet | 1 g | 16-2,984 | 11-1,989 |
| Cod | 3 oz | 99 | 66 |
| Plain yogurt, low-fat | 1 c | 75 | 50 |
| Iodized salt (¼ tsp) | 1.5 g | 71 | 47 |
| Milk, reduced-fat | 1 c | 56 | 37 |
| White bread | 2 slices | 45 | 30 |
| Ice cream, chocolate | ½ c | 30 | 20 |
| Egg | 1 large | 24 | 16 |
| Tuna, canned in oil | 3 oz | 17 | 11 |
| Prunes, dried | 5 each | 13 | 9 |
The RDA for iodine is 150 mcg/day for men and women. The UL for iodine is set at 1,100 mcg/day and applies to both food and supplements. However, people rarely exceed the UL. 14

A deficiency of iodine leads to decreased production of thyroid hormones (T3 and T4), also called hypothyroidism, and eventually an enlargement of the thyroid tissue in an attempt to obtain more iodine, causing goiter. Signs and symptoms of hypothyroidism include fatigue, sensitivity to cold, constipation, depression, and dry and itchy skin. The development of goiter may often be the most visible sign of chronic iodine deficiency in adulthood, but the consequences of low levels of thyroid hormone in utero can be severe. Thyroid hormone plays a major role in brain development and growth and fetuses and infants with severe iodine deficiency develop a condition known as congenital iodine deficiency, characterized by significant physical and neurological impairment. The World Health Organization (WHO) estimates iodine deficiency affects over two billion people worldwide and is the number one cause of preventable brain damage.15,16
Copper
Copper assists in electron transfer in the electron transport chain. Furthermore, copper is a cofactor of enzymes essential for iron absorption and transport. Other important functions of copper include connective tissue and neurotransmitter synthesis, and as an antioxidant. Symptoms of mild to moderate copper deficiency are rare. More severe copper deficiency can cause anemia from the lack of iron mobilization in the body for red blood cell synthesis. Other signs and symptoms include stunted growth in children and neurological problems, because copper is a cofactor for an enzyme that synthesizes myelin, which surrounds many nerves.
The richest sources of dietary copper include shellfish, seeds, and nuts.
Table 15.3.2 Copper Content of Various Foods17
| Food | Serving | Copper (mcg) | %DV |
| Beef liver, pan fried | 3 oz | 12,400 | 1,378 |
| Oysters, wild, cooked | 3 oz | 4,850 | 539 |
| Potato, cooked | 1 medium | 675 | 75 |
| Shiitake mushrooms, cooked | ½ c | 650 | 72 |
| Cashew nut, dry roasted | 1 oz | 629 | 70 |
| Crab, Dungeness, cooked | 3 oz | 624 | 69 |
| Sunflower seeds, toasted | ¼ c | 615 | 68 |
| Tofu, firm, raw | ½ c | 476 | 53 |
| Chickpeas | ½ c | 289 | 32 |
| Avocado | ½ c | 219 | 24 |
The AI for copper is 900 mcg/day for men and women. Copper deficiency is rare, as most Americans consume enough. The UL for copper is set at 10,000 mcg/day and applies to both food and supplements. Copper toxicity is rare in healthy individuals, although chronic exposure can result in liver damage and gastrointestinal symptoms, including abdominal pain, nausea, vomiting, and diarrhea.17
Zinc
Zinc is a cofactor for hundreds of enzymes in the human body and plays a direct role in energy metabolism, RNA, DNA, and protein synthesis. Zinc is also necessary for immune function, wound healing, and cell division. Like copper, zinc also has antioxidant functions.18
A wide variety of foods contain zinc. While oysters contain more zinc per serving than any other food, red meat and poultry provide the majority of zinc in the American diet. Phytates, a compound present in whole grain breads, cereals, and legumes bind zinc and inhibit its absorption. Thus, bioavailability of zinc from grains and plant foods is lower than that from animal foods, although many plant-based foods are still good sources of zinc.18
Table 15.3.3 Zinc Content of Various Foods18
| Food | Serving | Zinc (mg) | %DV |
| Oysters, breaded, fried | 3 oz | 74.0 | 673 |
| Beef, chuck roast, braised | 3 oz | 7.0 | 64 |
| Crab, Alaska king, cooked | 3 oz | 6.5 | 59 |
| Lobster, cooked | 3 oz | 3.4 | 31 |
| Pork loin chop, cooked | 3 oz | 2.9 | 26 |
| Baked beans, vegetarian, canned | ½ c | 2.9 | 26 |
| Pumpkin seeds | 1 oz | 2.2 | 20 |
| Cashews, roasted | 1 oz | 1.6 | 15 |
| Swiss cheese | 1 oz | 1.1 | 11 |
| Milk, low-fat | 1 c | 1.0 | 9 |
The RDA for zinc is 11 mg/day for men and 8 mg/day for women. The UL for zinc is set at 40 mg/day and applies to both food and supplements. Signs and symptoms of zinc toxicity include nausea, vomiting, loss of appetite, abdominal cramps, diarrhea, and headaches.18
As the result of its prominent roles in anabolic and energy metabolism, a zinc deficiency in infants and children stunts growth. In adults, severe zinc deficiency can cause hair loss, diarrhea, skin sores, loss of appetite, and weight loss. Additionally, since zinc is a required cofactor for an enzyme that synthesizes the heme portion of hemoglobin, severely deficient zinc diets can result in anemia.
Manganese
Manganese is a cofactor for enzymes that are required for glucose, amino acid, and cholesterol metabolism, bone formation, and the synthesis of urea.
The best food sources of manganese in the diets of US adults include grains, nuts, legumes, and vegetables.
Table 15.3.4 Manganese Content of Various Foods19
| Food | Serving | Manganese (mcg) | %DV |
| Mussels, blue, cooked | 3 oz | 5.8 | 252 |
| Hazelnuts, roasted | 1 oz | 1.6 | 70 |
| Pecans, roasted | 1 oz | 1.1 | 48 |
| Brown rice, cooked | ½ c | 1.1 | 48 |
| Oysters, Pacific, cooked | 3 oz | 1.0 | 43 |
| Clams, cooked | 3 oz | 0.9 | 39 |
| Chickpeas, cooked | ½ c | 0.9 | 39 |
| Spinach, boiled | ½ c | 0.8 | 35 |
| Pineapple, chunks | ½ c | 0.8 | 35 |
| Bread, whole wheat | 1 slice | 0.7 | 30 |
The AI for manganese is 2.3 mg/day for men and 1.8 mg/day for women. Manganese deficiency is uncommon. The UL for manganese is 11 mg, however there is little evidence suggesting toxicity from high dietary manganese intakes.19
Chromium
The functioning of chromium in the body is less understood than that of most other minerals. It plays a role in carbohydrate, fat, and protein metabolism and enhances the actions of insulin. Currently, the results of scientific studies evaluating the usefulness of chromium supplementation in preventing and treating type 2 diabetes are largely inconclusive. More research is needed to better determine if chromium is helpful in treating certain chronic diseases and, if so, at what doses.
Meat and whole grain products, as well as some fruits, vegetables, and spices are relatively good sources. In contrast, foods high in simple sugars tend to be lower in chromium.
Table 15.3.5 Chromium Content of Various Foods20
| Food | Serving | Chromium (mcg) | %DV |
| Broccoli | ½ c | 11 | 31 |
| Grape juice | 1 c | 8 | 23 |
| English muffin, whole wheat | 1 | 4 | 11 |
| Potatoes, mashed | 1 c | 3 | 9 |
| Orange juice | 1 c | 2 | 6 |
| Turkey breast | 3 oz | 2 | 6 |
| Bread, whole wheat | 2 slices | 2 | 6 |
| Apple | 1 medium | 1 | 3 |
| Banana | 1 medium | 1 | 3 |
| Green beans | ½ c | 1 | 3 |
The AI for chromium is 35 mcg/day for adult males and 25 mcg/day for adult females. There is insufficient evidence to establish an UL for chromium.20
Molybdenum
Molybdenum acts as a cofactor for four enzymes necessary for the metabolism of sulfur-containing amino acids and nitrogen-containing compounds found in DNA and RNA. It also plays a role in the breakdown of drugs and toxic substances that enter the body.21
Legumes, whole grains, and nuts are some of the richest sources of molybdenum.
Table 15.3.6 Molybdenum Content of Various Foods21
| Food | Serving | Molybdenum (mcg) | %DV |
| Black eyed peas, boiled | ½ c | 288 | 640 |
| Lima beans, boiled | ½ c | 104 | 231 |
| Yogurt (2%), plain | 1 c | 26 | 58 |
| Milk (2%) | 1 c | 22 | 49 |
| Potato, baked | 1 medium | 16 | 36 |
| Banana | 1 medium | 15 | 33 |
| Bread, whole wheat | 1 slice | 12 | 27 |
| Peanuts, roasted | 1 oz | 11 | 24 |
| Egg, soft boiled | 1 large | 9 | 20 |
| Spinach, boiled | ½ c | 8 | 18 |
The RDA for molybdenum is 45 mcg per day for adult men and women. The UL for molybdenum is 2,000 mcg, although toxicity is rare as it is rapidly excreted in urine.21
Sulfur
Amino acids, methionine and cysteine, contain sulfur which are essential for certain enzymes including the antioxidant enzyme glutathione peroxidase. Some vitamins like thiamin and biotin also contain sulfur which are important in regulating acidity in the body. Sulfur is a major mineral with no recommended intake or deficiencies when protein needs are met. Sulfur is mostly consumed as a part of dietary proteins and sulfur containing vitamins.
15.4 Electrolytes and Fluid Balance
As discussed in Chapter 13, water is the foundation of all life. Of all the nutrients, water is the most critical, as its absence proves lethal within a few days. Maintaining the right level of water in your body is crucial to survival, as either too little or too much will result in less-than-optimal functioning. Several minerals are key to regulating water balance in different compartments of the body; the most important of these are sodium, potassium, and chloride.
Recall that electrolytes are substances that when dissolved into water, dissociate into charged ions. There are two categories of electrolytes: positively charged cations and negatively charged anions (see Table 15.4.1). In extracellular fluid, sodium (Na+) is the major cation and chloride (Cl−) is the major anion. Potassium (K+) is the major cation inside cells. Together, these electrolytes are involved in many body functions, including water balance, acid-base balance, and assisting in the transmission of electrical impulses along cell membranes in nerves and muscles.
Table 15.4.1 Intracellular and Extracellular Electrolytes
| Intracellular | Extracellular | ||
| Cations | Anions | Cations | Anions |
| Potassium (K+) | Phosphate (PO4-) | Sodium (Na+) | Chloride (Cl–) |
| Magnesium (Mg2+) | Proteins | Bicarbonate (HCO3-) | |
| Sulfate (SO2-4) | Proteins | ||
One of the essential homeostatic functions of the body is to maintain fluid and electrolyte balance within cells and their surrounding environment. Cell membranes are selectively permeable: water can move freely through the cell membrane, while other substances, such as electrolytes, require special transport proteins, channels, and often energy (ATP). The movement of water between the intracellular and extracellular fluid happens via osmosis, the movement of water through a selectively permeable membrane from an area where solutes are less concentrated to an area where solutes are more concentrated.
To maintain water and electrolyte balance, cells control the movement of electrolytes across their membranes, and water follows the electrolytes by osmosis. The health of the cell depends on proper fluid and electrolyte balance. If the body’s fluid and electrolyte levels change too rapidly, cells can struggle to correct the imbalance quickly enough. For example, consider a person exercising strenuously, losing water and electrolytes in the form of sweat, and drinking excessive amounts of water. The excess water dilutes the sodium in the blood, leading to hyponatremia, or low blood sodium concentrations. Sodium levels within the cells are now more concentrated, leading water to enter the cells by osmosis. As a result, the cells swell with water and can burst if the imbalance is severe and prolonged.
In contrast, the opposite situation can occur in a person exercising strenuously for a long duration with inadequate fluid intake. This can lead to dehydration and hypernatremia, or elevated blood sodium levels. The high concentration of sodium in the extracellular fluid causes water to leave cells by osmosis, making them shrink. This scenario can also occur anytime a person is dehydrated because of significant fluid loss, such as from diarrhea and/or vomiting caused by illness.
When a person becomes dehydrated, and solutes like sodium become too concentrated in the blood, the thirst response is triggered. Sensory receptors in the thirst center in the hypothalamus monitor the concentration of solutes of the blood. If blood solutes increase above ideal levels, the hypothalamus transmits signals that result in a conscious awareness of thirst. The hypothalamus also communicates to the kidneys to decrease water output through the urine. This process is covered in detail in chapter 13.
The cell is able to control the movement of the two major cations, sodium and potassium, with a sodium-potassium pump (Na+/K+ pump). This pump transports sodium out of cells while moving potassium into cells.
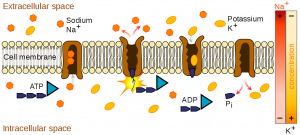
The sodium-potassium pump is an important ion pump found in the membranes of many types of cells and is particularly abundant in nerve cells. When a nerve cell is stimulated (e.g., the touch of a hand), there is an influx of sodium ions into the nerve cell. Similar to how a current moves along a wire, a sodium current moves along a nerve cell. Stimulating a muscle contraction also involves the movement of sodium ions. For a muscle to contract, a nerve impulse travels to a muscle. The movement of the sodium current in the nerve signals the muscle cell membrane to open and sodium rushes in, creating another current that travels along the muscle and eventually leading to muscle contraction. In both nerve and muscle cells, the sodium that went in during a stimulus now has to be moved out by the sodium-potassium pump in order for the nerve and muscle cell to be stimulated again.
Sodium
Although sodium often gets vilified because of its link to hypertension, it is an essential nutrient that is vital for survival. As just discussed, it is not only necessary for fluid balance, but crucial for nerve impulse transmission and muscle contraction.
In contrast to many other minerals, sodium absorption in the small intestine is extremely efficient and in a healthy individual all excess sodium is excreted by the kidneys. In fact, very little sodium is required in the diet (about 200 mg) because the kidneys actively reabsorb sodium. Kidney reabsorption of sodium is hormonally controlled, allowing for a relatively constant sodium concentration in the blood.
Sodium is essential for nutrient absorption in the small intestine and also for nutrient reabsorption in the kidney. Amino acids, glucose, and water must make their way from the small intestine to the blood. To do so, they pass through cells in intestinal walls to get to the capillaries in the villi and into the blood via sodium-potassium pump.
While a bit of sodium occurs naturally in some foods, more than 70% of the sodium we consume comes from processed, prepackaged, and restaurant foods (Figure 15.4.2). Many people are surprised by the amount of sodium in foods that do not taste particularly salty. In fact, these foods, known as the salty six are some of the top sodium sources in the US diet 22:
- Breads and rolls
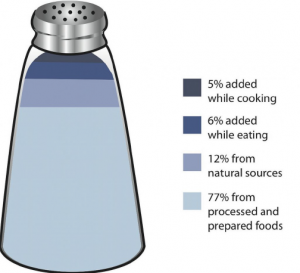
Figure 15.4.2 Salt Sources in the Diet - Pizza
- Sandwiches
- Cold cuts and cured meats
- Soup
- Burritos and tacos
As stated previously, sodium is imperative for optimal functioning in the body, however, most Americans consume more than necessary. The NAM estimates that greater than 95% of men and 75% of women in America consume salt in excess of the UL. The AI for sodium in adults aged 19-50 years old is 1,500 mg. Table salt is approximately 40% sodium, and 60% chloride. As a reference point, only ⅔ teaspoon of salt is needed to meet the AI for sodium.
The AI takes into account the amount of sodium lost in sweat during recommended physical activity levels and additionally provides for the sufficient intake of other nutrients, such as chloride. The UL for sodium is 2,300 mg/day for adults. Again, as a point of reference, just over one teaspoon of salt contains the 2,300 mg of sodium recommended. The UL is considered appropriate for healthy individuals but not those with hypertension (high blood pressure). Many scientific studies demonstrate that reducing salt intake can reduce risk of developing hypertension, is helpful in reducing blood pressure after hypertension is diagnosed, and reduces the risk for additional cardiovascular diseases.23
According to Harvard Medical School, “About 60% of people with high blood pressure are thought to be salt-sensitive [a trait that means your blood pressure increases with a high-sodium diet]. So are about a quarter of people with normal blood pressure, although they may develop high blood pressure later, since salt sensitivity increases with age and weight gain.”24 Genetics, race, sex, weight, and physical activity level are determinants of salt sensitivity. African Americans, women, and overweight individuals are more salt-sensitive than others. High sodium intake also increase calcium excretion, but studies have not found an increased risk of osteoporosis. This sodium mediated loss of calcium may increase the risk of kidney stones.
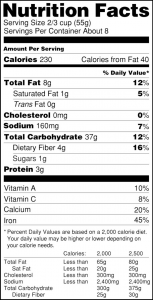
The Nutrition Facts Label (NFL) displays the amount of sodium (in mg) per serving of the food. It also provides the % Daily Value (%DV). Recall from Chapter 2 that a %DV of 5% or below means that a serving of the product is low in sodium, if a %DV is 20% or higher, that product is high in sodium and perhaps should be avoided. Food additives are often high in sodium, for example, monosodium glutamate (MSG) contains 12%DV of sodium. Additionally, baking soda, baking powder, disodium phosphate, sodium alginate, and sodium nitrate or nitrite contain a significant proportion of sodium as well. When you see a food’s NFL, you can check the ingredients list to identify the source of the added sodium. Various claims about the sodium content in foods must be in accordance with FDA regulations (see Table 15.4.2).25
Table 15.4.2 Food Packaging Claims Regarding Sodium.25
| Claim | Definition |
| Light or Low in sodium | Sodium reduced by 50% from reference product |
| No salt added/Unsalted | No salt added during preparation or processing (Must also declare on package “This is not a sodium-free food” if food is not sodium-free) |
| Lightly salted | 50% less sodium than that added to similar food |
| Sodium free/Salt free | Contains less than 5 mg of sodium per serving |
| Very low salt | Contains less than 35 mg of sodium per serving |
| Low salt | Contains less than 140 mg of sodium per serving |
To decrease your sodium intake, become a salt-savvy shopper by reading the labels and ingredient lists of processed foods and choosing those lower in salt. Even better, stay away from processed foods and control the seasoning of your foods. Eating a diet with fewer salty foods diminishes salt cravings so you may need to try a lower sodium diet for a week or two before you will be satisfied with the less salty food. You can also use salt alternatives to flavor your food instead of using salt. Fresh or dried herbs like rosemary, thyme, dill, or parsley can add flavor to dishes, garlic and curry have been used for thousands of years as flavoring, and spices like cinnamon and paprika can pack a powerful flavor punch without adding sodium.26
Salt Substitutes
For those with hypertension or those looking for a way to decrease salt use, using a salt substitute for food preparation is one option. However, many salt substitutes still contain sodium, just in lesser amounts than table salt. Also, remember that most salt in the diet is not from table salt use, but from processed foods. Salt substitutes often replace the sodium with potassium. People with kidney disorders can have problems getting rid of excess potassium and are advised to avoid salt substitutes containing potassium. People with liver disorders should also avoid salt substitutes containing potassium because their treatment is often accompanied by potassium dysregulation. If this is an issue for you, check labels of salt substitutes carefully.
Too much sodium is certainly problematic, but so is too little sodium. Sweating is a homeostatic mechanism for maintaining body temperature, which influences fluid and electrolyte balance. Sweat is mostly water but also contains some electrolytes, mostly sodium and chloride. Under normal environmental conditions (i.e., not hot, humid days) water and sodium loss through sweat is negligible, but is highly variable among individuals. It is estimated that 60 minutes of high-intensity physical activity, like playing a game of tennis, can produce approximately one liter of sweat; however the amount of sweat produced is highly dependent on environmental conditions. A liter of sweat typically contains between 1-2 g of sodium and therefore exercising for multiple hours can result in a high amount of sodium loss in some people. Additionally, hard labor, especially outdoors, can produce substantial sodium loss through sweat. In either case, the lost sodium is easily replaced in the next snack or meal. A rare, life-threatening condition of very low blood sodium levels or hyponatremia is not so much the result of excessive sodium losses but rather drinking too much water. The excess water dilutes the sodium concentration in the blood. It can also be caused by excessive vomiting, sweating, and diarrhea. The symptoms of hyponatremia, also called water intoxication (since it is often the root cause), include nausea, muscle cramps, confusion, dizziness, and in severe cases, coma and death.
Chloride
Chloride is the primary anion in extracellular fluid. In addition to passively following sodium, chloride has its own protein channels that reside in cell membranes. These protein channels are especially abundant in the gastrointestinal tract, pancreas, and lungs.
Chloride aids in fluid balance mainly because it follows sodium in order to maintain charge neutrality. Chloride channels also play a role in regulating fluid secretion, such as pancreatic juice into the small intestine and the flow of water into mucus.
Chloride has several other functions in the body, most importantly in acid-base balance. Blood pH is maintained in a narrow range and the number of positively charged substances is equal to the number of negatively charged substances. Proteins, such as albumin, as well as bicarbonate ions and chloride ions, are negatively charged and aid in maintaining blood pH. Hydrochloric acid (composed of chlorine and hydrogen) aids in digestion and also prevents the growth of unwanted microbes in the stomach. Immune system cells require chloride, and red blood cells use chloride anions to remove carbon dioxide from the body.
Most chloride in the diet comes from salt, which as previously stated is 60% chloride. A teaspoon of salt equals 5750 mg, containing 3,450 mg of chloride and 2,300 mg of sodium. Other dietary sources include all foods containing sodium chloride, as well as tomatoes, lettuce, olives, celery, rye, whole grain foods, and seafood.
The AI for chloride in adults is 2,300 mg. Therefore, just ⅔ teaspoon of table salt per day is sufficient for chloride as well as sodium. The UL is set at 3,600 mg.23 Excess chloride in the blood is rare with no characteristic signs or symptoms.
Low dietary intake of chloride and more often diarrhea can cause low blood levels of chloride. Symptoms typically are similar to those of hyponatremia and include weakness, nausea, and headache.
Potassium
Potassium is the most abundant positively charged ion inside of cells. The majority of potassium (90%) exists in intracellular fluid, with about 10% in extracellular fluid, and only 1% in blood plasma. As with sodium, potassium levels in the blood are strictly regulated. The hormone aldosterone is what primarily controls potassium levels, but other hormones (such as insulin) also play a role. When potassium levels in the blood increase, the adrenal glands release aldosterone. Aldosterone acts on the collecting ducts of kidneys, where it stimulates an increase in the number of sodium-potassium pumps. Sodium is then reabsorbed and more potassium is excreted. Because potassium is required for maintaining sodium levels, and hence fluid balance, about 200 mg of potassium are lost from the body every day.
Nerve impulses involve not only sodium, but also potassium. A nerve impulse moves along a nerve via the movement of sodium ions into the cell. To end the impulse, potassium ions rush out of the nerve cell, thereby decreasing the positive charge inside the nerve cell. This diminishes the stimulus. To restore the original concentrations of ions between the intracellular and extracellular fluid, the sodium-potassium pump transfers sodium ions out in exchange for potassium ions in. On completion of the restored ion concentrations, a nerve cell is now ready to receive the next impulse. Similarly, in muscle cells potassium is involved in restoring the normal membrane potential and ending the muscle contraction. Potassium is also involved in protein synthesis, energy metabolism, platelet function, and acts as a buffer in blood, thus playing a role in acid-base balance.
Fruits and vegetables that contain high amounts of potassium are spinach, lettuce, broccoli, peas, tomatoes, potatoes, bananas, apples, and apricots. Whole grains and seeds, certain fish (such as salmon, cod, and flounder), and meats also provide potassium. Greater than 90% of dietary potassium is absorbed in the small intestine. Although highly bioavailable, potassium is a very soluble mineral and easily lost during cooking and processing of foods. Fresh and frozen foods are better sources of potassium than canned or processed foods.
Table 15.4.3 Potassium Content of Various Foods27
| Food | Serving | Potassium (mg) | %DV |
| Apricots, dried | ½ c | 1,101 | 23 |
| Lentils, cooked | 1 c | 731 | 16 |
| Acorn squash, mashed | 1 c | 644 | 14 |
| Raisins | ½ c | 618 | 13 |
| Potato, baked | 1 medium | 610 | 13 |
| Kidney beans, canned | 1 c | 607 | 13 |
| Orange juice | 1 c | 496 | 11 |
| Banana | 1 medium | 422 | 9 |
| Milk (1%) | 1 c | 366 | 8 |
| Spinach, raw | 2 c | 334 | 7 |
The AI for potassium is 3,400 mg/day for men and 2,600 mg/day for women. There is no UL set for potassium.27 Please recall that DRIs are applicable only to healthy individuals. People with chronic kidney disease or those using certain medications may be at higher risk for hyperkalemia which is very high levels of potassium in the blood. Although hyperkalemia can be asymptomatic, severe cases can cause muscle weakness, paralysis, heart palpitations, paresthesias (a burning or prickling sensation in the extremities), and cardiac arrhythmias (irregular heart beats) that could be life threatening.
The 2020-2025 Dietary Guidelines for Americans identifies potassium as a “dietary component of public health concern,” because dietary surveys consistently show that people in the US consume less potassium than is recommended.28 This is a nutritional gap that must be corrected through food since most dietary supplements do not contain significant amounts of potassium.
Insufficient potassium levels in the body hypokalemia can be caused by a low dietary intake of potassium or by high sodium intakes, but more commonly it results from medications that increase water excretion, mainly diuretics. The signs and symptoms of hypokalemia are related to the functions of potassium in nerve cells and consequently skeletal and smooth muscle contraction and include muscle weakness and cramps, constipation, and respiratory distress. Severe potassium depletion can cause the heart to have abnormal contractions and can even be fatal.
Key Takeaways
- While micronutrients themselves do not provide energy, all the B vitamins and several minerals serve as coenzymes or cofactors in energy metabolism.
- Thiamin is necessary coenzyme in aerobic metabolism. A deficiency in thiamin can cause beriberi which can cause fatigue, confusion, impaired movement, and heart failure. It is most common in societies where white rice is the main dietary staple.
- Riboflavin is important for flavoproteins that participate in the electron transport chain and functions of other B vitamin coenzymes. Ariboflavinosis is its deficiency disease.
- Niacin is required for NADH, an integral part of the electron transport chain. It’s deficiency disease, pellagra, is characterized by the 4 Ds. Niacin also has a upper limit and high doses can cause niacin flush.
- Pantothenic acid is required to synthesize coenzyme A, necessary for the Kreb’s cycle. There is no UL and deficiency is extremely rare.
- Vitamin B6 plays a role in the amino acid synthesis and glycogenolysis. An upper limit exists for niacin, especially for supplementation, and deficiency can lead to anemia.
- Biotin is important for lipid metabolism and glucose synthesis. This vitamin has no RDA or UL, but an AI and deficiency is rare.
- Folate is important for amino acid synthesis and RNA/DNA production. Deficiency of folic acid can cause macrocytic, megaloblastic anemia. During pregnancy, folic acid is essential to prevent birth defects such as spina bifida and anencephaly. Folate is the one micronutrient that is more bioavailable in supplement form than food. However, dark green leafy vegetables are an excellent source of this vitamin.
- Vitamin B12 is an essential part of several coenzymes. It works with folate for amino acid and DNA synthesis. A deficiency in B12 also causes macrocytic, megaloblastic anemia. It is also associated with pernicious anemia which occurs when the stomach does not secrete enough intrinsic factor, a protein required for B12 absorption. It is only found in animal foods and there is no UL.
- While not a vitamin, choline is very similar to the B vitamins and is considered an essential nutrient that is necessary for the synthesis of acetylcholine and phospholipids.
- Iodine is necessary for the synthesis of thyroid hormone which regulates basal metabolism. Iodized salt and dairy products are the major sources of this mineral in the American diet. A deficiency can lead to hypothyroidism and goiter.
- Zinc is a cofactor for hundreds of enzymes and plays a direct role in energy metabolism. While found in many different foods, zine is typically more bioavailable in animal foods. There are toxicity and deficiency issues associated with this mineral.
- Copper, manganese, chromium, and molybdenum, all trace minerals, also serve as cofactors in metabolism.
- Sodium, chloride and potassium are the primary electrolytes responsive for maintain water balance I the body. The sodium-potassium pump is essential for nerve and muscle cell activation.
- Sodium is a major mineral and the primary regulator of water balance. It also plays important roles in nerve transmission, muscle contraction, and nutrient absorption and reabsorption.
- Most sodium in the typical American diet comes from processed and prepared foods, and most Americans consume more than they need. High sodium intake has been linked to hypertension.
- Chloride is linked to sodium in salt. It aids in fluid balance by helping to maintain charge neutrality. Chloride channels also play a role in regulating fluid secretion, such as the flow of pancreatic juice into the small intestine and the flow of water into mucus.
- Potassium is the most abundant positively charged ion inside of cells, and similar to sodium, potassium levels in the blood are under strict regulatory control. Potassium is the exchanged cation for sodium and helps maintain fluid balance. It also plays roles in nerve transmission, muscle contraction, protein synthesis, energy metabolism, platelet function, and acid-base balance. The best sources of potassium are whole foods like vegetables, legumes, and fruits.
Portions of this chapter were taken from OER Sources listed below:
Callahan, A., Leonard, H., Powell, T. (2020). Nutrition: Science and Everyday Application. https://openoregon.pressbooks.pub/nutritionscience/
Jellum, L., Hitzeman, J., Krauss, M., Henderson, S., Harnden, T., Elsberry, C., & Ford, G. (2018). Principles of Nutrition Textbook, Second Edition. Nursing and Health Sciences Open Textbooks. 5. https://oer.galileo.usg.edu/health-textbooks/5
Tharalson, J. (2019). Nutri300:Nutrition. https://med.libretexts.org/Courses/Sacremento_City_College/SSC%3A_Nutri_300_(Tharalson)
Titchenal, A., Calabrese, A., Gibby, C., Revilla, M.K.F., & Meinke, W. (2018). Human Nutrition. University of Hawai’i at Manoa Food Science and Human Nutrition Program Open Textbook. https://pressbooks.oer.hawaii.edu
Additional References:
- Price, C. (2015). Vitamania: How vitamins revolutionized the way we think about food. Penguin Books.
- Pope, J., Nizielski, S., & McCook, A. (2016). Nutrition for a changing world. (1st ed.). W. H. Freeman.
- Office of Dietary Supplements. (2020, June 3). Thiamin. National Institute of Health. https://ods.od.nih.gov/factsheets/Thiamin-HealthProfessional/
- Office of Dietary Supplements. (2020, June 3). Riboflavin. National Institute of Health. https://ods.od.nih.gov/factsheets/Riboflavin-HealthProfessional/
- Office of Dietary Supplements. (2020, June 3). Niacin. National Institute of Health. https://ods.od.nih.gov/factsheets/Niacin-HealthProfessional/
- National Institutes of Health. (n.d.). Dr. Joseph Goldberger & the war on pellagra. Office of NIH History & Stetten Museum. https://history.nih.gov/pages/viewpage.action?pageld=8883184
- Office of Dietary Supplements. (2020, June 3). Pantothenic Acid. National Institute of Health. https://ods.od.nih.gov/factsheets/PantothenicAcid-HealthProfessional/
- Office of Dietary Supplements. (2020, February 24). Vitamin B6. National Institute of Health. https://ods.od.nih.gov/factsheets/VitaminB6-HealthProfessional/
- Office of Dietary Supplements. (2020, June 3). Biotin. National Institute of Health. https://ods.od.nih.gov/factsheets/Biotin-HealthProfessional/
- Office of Dietary Supplements. (2020, June 3). Folate. National Institute of Health. https://ods.od.nih.gov/factsheets/Folate-HealthProfessional/
- Office of Dietary Supplements. (2020, March 30). Vitamin B12. National Institute of Health. https://ods.od.nih.gov/factsheets/VitaminB12-HealthProfessional/
- Office of Dietary Supplements. (2020, June 3). Choline. National Institute of Health. https://ods.od.nih.gov/factsheets/Choline-HealthProfessional/
- Porter, K., Hoey, L., Hughes, C., Ward, M., & McNulty, H. (2016). Causes, consequences and public health implications of low B-vitamin status in ageing. Nutrients, 8(11), 725. MDPI AG. http://dx.doi.org/10.3390/nu8110725
- Office of Dietary Supplements. (2020, May 1). Iodine. National Institute of Health. https://ods.od.nih.gov/factsheets/Iodine-HealthProfessional/
- World Health Organization. (n.d.). Micronutrient deficiencies. https://www.who.int/nutrition/topics/ida/en/
- Biban, B. G., & Lichiardopol, C. (2017). Iodine deficiency, still a global problem? Current Health Sciences Journal, 43(2), 103-111. https://doi:10.12865/CHSJ.43.02.01
- Office of Dietary Supplements. (2020, June 3). Copper. National Institute of Health. https://ods.od.nih.gov/factsheets/Copper-HealthProfessional/
- Office of Dietary Supplements. (2020, March 6). Zinc. National Institute of Health. https://ods.od.nih.gov/factsheets/Zinc-HealthProfessional/
- Office of Dietary Supplements. (2020, June 3). Manganese. National Institute of Health. https://ods.od.nih.gov/factsheets/Manganese-HealthProfessional/
- Office of Dietary Supplements. (2020, February 27). Chromium. National Institute of Health. https://ods.od.nih.gov/factsheets/Chromium-HealthProfessional/
- Office of Dietary Supplements. (2020, June 3). Molybdenum. National Institute of Health. https://ods.od.nih.gov/factsheets/Molybdenum-HealthProfessional/
- American Heart Association. (2018, May 23). Sodium sources: Where does all that sodium come from? https://www.heart.org/en/healthy-living/healthy-eating/eat-smart/sodium/sodium-sources
- Institute of Medicine Food and Nutrition Board. (2004). Dietary reference intakes for water, potassium, sodium, chloride, and sulfate. The National Academies Press.
- Harvard Health Publishing. (2019, August ). Salt sensitivity: Sorting out the science. Retrieved from https://www.health.harvard.edu/heart-health/salt-sensitivitysorting-out-the-science
- United States Food and Drug Administration. (2009). Food labeling guide. http://www.fda.gov/Food/GuidanceComplianceRegulatoryInformation/GuidanceDocuments/FoodLabelingNutrition/FoodLabelingGuide/ucm064911.htm.
- American Heart Association. (2012). Shaking the salt habit. http://www.heart.org/HEARTORG/Conditions/HighBloodPressure/PreventionTreatmentofHighBloodPressure/Shaking-the-Salt-Habit_UCM_303241_Article.jsp
- Office of Dietary Supplements. (2020, June 3). Potassium. National Institute of Health. https://ods.od.nih.gov/factsheets/Potassium-HealthProfessional/
- US Department of Agriculture and US Department of Health and Human Services. (2020). Dietary Guidelines for Americans, 2020-2025, 9th Edition. Retrieved from https://www.dietaryguidelines.gov/
organic molecules required by enzymes to catalyze a specific reaction
inorganic minerals that bind to enzymes to assist in chemical reactions
Condition caused by deficiency of thiamin (vitamin B1)
Condition of deficiency of riboflavin (vitamin B2)
breakdown of molecules into smaller units
building of molecules and tissues
Side effect in some people of excessive consumption of niacin (vitamin B3). Causes redness of the face, arms, chest due to vasodilation of small blood vessels. You may also experience tingling, burning and itching.
condition caused by severe niacin (vitamin B3) deficiency
substance made in the stomach that is required for vitamin B12 absorption; secretion of this substance slowly naturally declines after age 50
Decreased production of thyroid hormones, primarily T3 and T4.
Enlargement of the thyroid gland caused by a severe and chronic deficiency of iodine.
A non-protein chemical compound (often a mineral) that is required for some enzymes to function.
passive movement of fluids through a membrane from areas of higher concentration to areas of lower concentration
very low levels of sodium in the blood; can be life-threatening, usually caused by excessive water intake (water intoxication)
High levels of potassium in the blood which can be life threatening.
Low levels of potassium in the blood.
