Chapter 2: Choosing Foods Wisely
“Eat food. Not too much. Mostly plants.”
-Michael Pollan, author of “In Defense of Food: An Eater’s Manifesto” and the “The Omnivore’s Dilemma”
How do you decide what to eat every day? Are your choices based on price? Your culture? Your upbringing? Habit? Your familiarity with the foods and personal preferences such as organic, sustainable, fair trade, healthy? Information on the label such as allergens? Dietary recommendations provided by science-based and/or governmental organizations? As adults, it is estimated that we make over 200 decisions each day regarding food. Most of these choices are unconscious. It’s complicated. We choose when, where, what, with whom, and how much to eat at each meal or snack. In this chapter we will look at some of the things that may influence our decisions about food: the dietary recommendations from US governmental agencies, factors that drive our food choices, the characteristics of a healthy diet, and food labeling.
Learning Objectives
- Describe the action steps of the 2020-2025 Dietary Guidelines for Americans and ChooseMyPlate.
- Estimate your daily energy requirement and calculate Acceptable Macronutrient Distribution Ranges (AMDRs).
- Describe factors that affect food choices.
- Identify factors to consider when developing a healthy diet.
- Describe the current state of the American diet.
- Assess portion sizes of foods.
- Use the Nutrition Facts Label (NFL) to evaluate the nutritional information of food.
- Describe the types of claims allowed on food packaging and be able to categorize claims.
2.1 History of US Food Guidelines
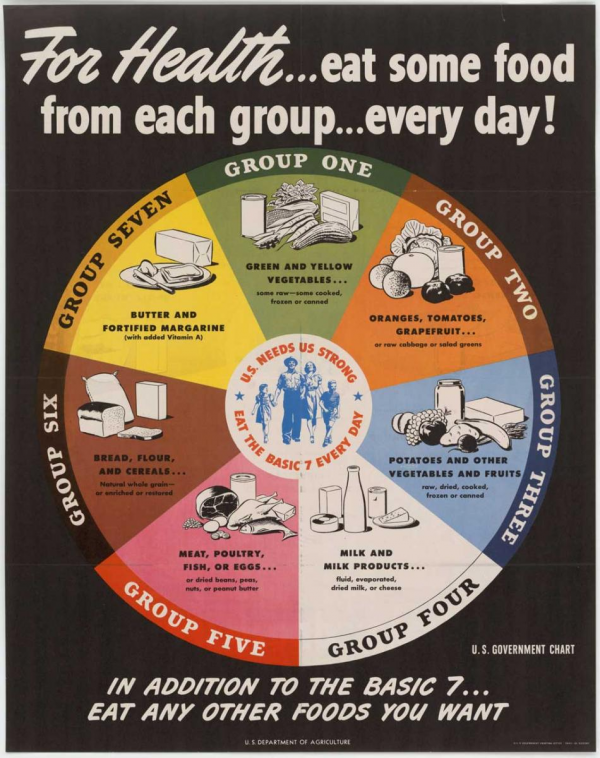
The first US dietary recommendations were set by the National Academy of Sciences in 1941. The Recommended Dietary Allowances (RDA) were first established out of concern that America’s overseas World War II troops were not consuming enough daily nutrients to maintain good health. The first Food and Nutrition Board was created in 1941, and in the same year set recommendations for the adequate intake (AI) of kcal and eight essential nutrients (iron, calcium, vitamins A, C, and D, thiamin, riboflavin, and niacin)1. The “Basic Seven” food groups were introduced as well to include:
- Green and yellow vegetables
- Oranges, tomatoes, grapefruit
- Potatoes and other vegetables and fruits
- Milk and milk products
- Meat, poultry, fish, and eggs
- Bread, flour, and cereals
- Butter and fortified margarine
This information was disseminated to officials responsible for food relief for armed forces and civilians supporting the war effort. The focus was intended to increase adequate consumption of nutrients and while the daily number of each food group was provided, serving sizes were not.
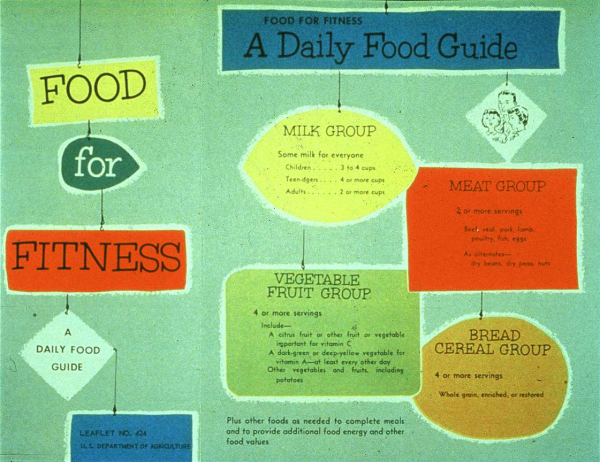
Beginning in the mid-1950s until 1992, the United States Department of Agriculture (USDA) recommended the “Basic Four” consisting of the milk group, meat group, vegetable and fruit group, and bread groups with other foods as needed to complete meals. Budgeting was emphasized as well. The focus was primarily on getting adequate nutrition and “healthy” eating.
In 1977, the Dietary Goals for Americans were released. This document directly linked too much fat, sugar, and salt intake with heart disease, cancer, obesity and other chronic diseases. Specific guidelines regarding carbohydrate, fat, cholesterol, sugar, and salt intake were provided. The first official Dietary Guidelines for Americans were issued in 1980 and have been re-evaluated and updated every five years by the USDA and the United States Department of Health and Human Services (HHS)1. Why are such guidelines necessary? They provide standardized, consistent recommendations for policy makers and healthcare providers to improve nutrition and the health of the US population.
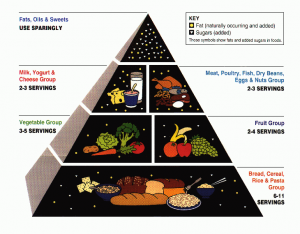
The original Food Guide Pyramid graphic was introduced in 1992 as a total diet approach with goals for both nutrient adequacy and moderation. In addition to outlining the five food groups in recommended proportion, it also referenced fats and sugars.2 Graphics like this were created to help focus the message(s) of the Dietary Guidelines for Americans.
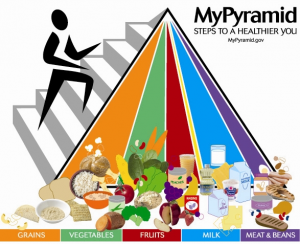
This graphic remained until 2005, when MyPyramid was introduced with the new Dietary Guidelines for Americans. The pyramid image was retained, but was simplified based on consumer research. Vertical bands were featured for each of the five food groups along with an additional band for oil. The concept of physical activity was also included.2
2.2 Current Dietary Guidelines for Americans and ChooseMyPlate
As stated previously, the Dietary Guidelines for Americans are published every five years and several governmental agencies (primarily the USDA and HHS) work together to create and distribute these with feedback from the scientific community and the public. The first edition was published in 1980. The most recent version, Dietary Guidelines 2020-2025, is the 9th edition, and is entitled “Make Every Bite Count With the Dietary Guidelines.” The guidelines focus on the importance of a healthy dietary pattern throughout the lifecycle, and provide specific recommendations for all life stages including infants and toddlers, children, adolescents, adults of all ages, and pregnant and lactating women.
The 2020 Dietary Guidelines consist of four major action steps for the American public to improve their eating habits:
- Follow a healthy eating pattern across the lifespan.
- Customize and enjoy nutrient dense food and beverage choices to reflect personal preferences, cultural traditions, and budgetary considerations.
- Focus on meeting food group needs with nutrient dense foods and beverages, and stay within kcal limits.
- Limit foods and beverages higher in added sugars, saturated fat, and sodium, and alcoholic beverages.
A healthy eating pattern includes:
- A variety of vegetables from all of the subgroups—dark green, red and orange, legumes (beans and peas), starchy, and other
- Fruits, especially whole fruits
- Grains, at least half of which are whole grains
- Fat-free or low-fat dairy, including milk, yogurt, cheese, and/or fortified soy beverages
- A variety of protein foods, including seafood, lean meats and poultry, eggs, legumes (beans and peas), nuts, seeds, and soy products
- Oils including vegetable oils and oils in food (such as seafood and nuts)
High consumption of certain foods, such as added sugars, saturated or trans fat, sodium, and refined grains, may contribute to the increased incidence of chronic disease. Additionally, excessive consumption of these foods replaces the intake of more nutrient dense foods. Table 2.2.1 outlines the following components of the diet that should be limited in order to achieve a healthy eating pattern.
Table 2.2.1 A Little Less of These, Please
| Dietary Constituent | Health Implications | Recommendations |
| Excess sodium | High blood pressure | Limit to 2,300 mg daily |
| Excess saturated fat | Cardiovascular disease | Limit to <10% of total calories |
| Trans fat | Cardiovascular disease | Minimal |
| Excess cholesterol | Cardiovascular disease | Limit to <300 mg daily |
| Excess added sugar | Obesity, type 2 diabetes | Limit to <10% of total calories |
| Excess alcohol | Impaired liver function | No more than 1 drink/day for women, 2 drinks/day for men |
In addition to diet, physical activity is important to promote health and reduce the risk of chronic disease. Therefore, it is recommended that all Americans regardless of age should meet the Physical Activity Guidelines for Americans. These will be discussed in more detail in Chapter 12, Nutrition and Fitness.
Food for Thought
Which suggestions from the 2020-2025 Dietary Guidelines do you already incorporate into your diet? How can you align your personal dietary goals with these recommendations?
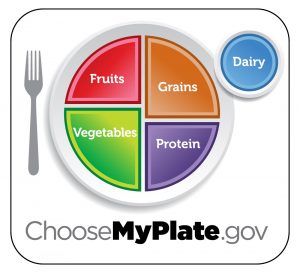
ChooseMyPlate
ChooseMyPlate3 was introduced in 2011 and is the current graphic that accompanies the 2020 Dietary Guidelines. It is a visual reminder that all your food and beverage choices count. Key messages include making healthy food and beverage choices by choosing those with less added sugars, saturated fat, and sodium. Choose from all five food groups, making at least half your plate fruits and vegetables, and avoiding oversized portions.
Within the fruit food group, recommendations include consuming fresh, canned, frozen, or dried fruit, while minimizing fruit juice. Variety is also important. For sedentary adults, 1-2 cups of fruit is recommended daily. Adults participating in more physical activity may need to consume more.
Any vegetable or 100% vegetable juice counts toward the vegetable food group. Vegetables may be raw or cooked, fresh, frozen, canned, or dehydrated, and may be whole, cut-up, or mashed. The average amount a sedentary adult needs can vary between 1-3 cups each day. Physically active adults likely need more. Based on their nutrient content, vegetables are organized into 5 subgroups:
- Dark green vegetables include broccoli, kale, spinach, turnip greens, etc. Most sedentary adults should aim for 1.5-2 cups per week.
- Red and orange vegetables include several types of squash, carrots, pumpkin, red peppers, and sweet potatoes. Sedentary adults should aim to consume 4-6 cups per week.
- Beans and peas consist of numerous types of beans (black, kidney, navy, pinto, etc.), black-eyed peas, lentils, and soybeans, etc. Most sedentary adults should aim to consume 1-2 cups per week. This is a unique category, however, because these foods also fit into the protein food group. These foods should first be counted toward one’s recommended intake of protein and then toward the vegetable group.
- Starchy vegetables include green peas, jicama, plantains, potatoes, corn, water chestnuts, etc. Sedentary adults should aim to consume 4-6 cups per week.
- Other vegetables include asparagus, avocado, bean sprouts, beets, cabbage, celery, eggplant, green peppers, onions, mushrooms, etc. Most sedentary adults should consume 3.5-5 cups per week.
Items within the grain food group include those made of wheat, rice, oats, and barley, etc. Bread, pasta, cereal, grits, popcorn, and tortillas are all examples of grain foods. Most sedentary adults should aim for 3-8 oz-equivalents daily and at least half of all the grains you eat should be 100% whole grain. We will discuss the difference between whole grains and refined grains more in Chapter 5, Carbohydrates.
All foods made from meat, poultry, seafood, beans and peas, eggs, processed soy products, nuts, and seeds are considered part of the protein food group. It is recommended to consume a variety of protein foods including at least 8 oz of seafood per week. Meat and poultry choices should be lean or low-fat. Sedentary adults should consume 5-6.5 oz a day. Most Americans eat enough food from this group, but need to make leaner and more varied selections of these foods.
Fluid milk and milk products that retain their calcium content, such as yogurt and cheese, are part of the dairy food group. Calcium-fortified soy milk (soy beverage) is also included. Foods made from milk that have little to no calcium, such as cream cheese, ice cream, and butter, are not included. It is recommended to choose low-fat (1%) or skim milk products. Adults should aim for 3 cups of dairy daily.
While not technically a food group, oils are an important part of a healthy diet. Common sources of healthy oils include canola oil, olive oil, nuts, olives, some fish and avocados. Adults should consume 5-7 tsp of oil daily.
This is a brief overview of the MyPlate recommendations. For more information, please explore the ChooseMyPlate.gov website.
Food for Thought
After reviewing MyPlate, how do your regular dietary habits compare? Are you eating the appropriate servings of fruits and vegetables? How many protein varieties are you consuming?
2.3 Personal Nutrition: How Much is Too Much?
Estimated Energy Requirements
In Chapter 1, you learned about Calories and energy. A natural question might be “how much energy or kcal should I consume on a daily basis?” There are several standardized mathematical equations that can be used to estimate your daily kcal needs or Estimated Energy Requirements (EER). These equations take into account age, sex, weight, height, and physical activity level. One such equation, devised by the National Academy of Medicine (NAM) is calculated as follows:
Adult male: EER = 662 – [9.53 x age (y)] + PA x [15.91 x wt (kg) + 539.6 x ht (m)]
Adult female: EER = 354 – [6.91 x age (y)] + PA x [9.36 x wt (kg) + 726 x ht (m)]
Note: To convert pounds to kilograms, divide weight in pounds by 2.2; To convert feet to meters, divide height in inches* by 39.4; Use Table 2.3.1 to identify the appropriate PA value.
(*height in inches = [(height in feet x 12) + additional inches] Ex. if you are 5’8″ tall, (5 x 12) + 8 = 68 inches)
Table 2.3.1 Physical Activity (PA) Categories and Values
| Activity Level | Male PA value | Female PA Value | Description |
| Sedentary | 1.00 | 1.00 | No physical activity beyond that required for independent living |
| Low | 1.11 | 1.12 | Equivalent to walking up to 3 miles per day at 3-4 mph in addition to activities of independent living |
| Moderate | 1.25 | 1.27 | Equivalent of walking 3 to 10 miles per day at 3-4 mph in addition to activities of independent living |
| High | 1.48 | 1.45 | Equivalent of walking 10 or more miles per day at 3-4 mph in addition to activities of independent living |
The numbers within these equations for the EER were derived from measurements taken from a group of people of the same sex and age with similar body size and physical activity level. These standardized formulas are then applied to individuals whose measurements have not been taken, but who have similar characteristics in order to estimate their energy requirements. Thus, a person’s EER is, as the name suggests, an estimate for an average person of similar characteristics. EER values are different for children, pregnant or lactating women, and for overweight or obese people. Also, remember that most EER equations are calculated based on weight maintenance, and not for weight loss or weight gain.
The 2020 Dietary Guidelines provides the estimated daily kcal needs for different age groups of males and females with various activity levels (see Table 2.3.2). It also states that while knowing the estimated number of kcal you need each day is useful, it is important to obtain your kcal from nutrient dense foods and consume the various macronutrients within the Acceptable Macronutrient Distribution Ranges (AMDRs).
Table. 2.3.2 Estimated Daily Calorie Needs from the 2020 USDA Dietary Guidelines4
| Sex | Age (Yrs) | Sedentary | Moderately Active | Active |
| Male | 14-18 | 2,000-2,400 | 2,400-2,800 | 2,800-3,200 |
| 19-30 | 2,400-2,600 | 2,600-2,800 | 3,000 | |
| 31-50 | 2,200-2,400 | 2,400-2,600 | 2,800-3,000 | |
| 51+ | 2,000-2,200 | 2,200-2,400 | 2,400-2,800 | |
| Female | 14-18 | 1,800 | 2,000 | 2,400 |
| 19-30 | 1,800-2,000 | 2,000-2,200 | 2,400 | |
| 31-50 | 1,800 | 2,000 | 2,200 | |
| 51+ | 1,600 | 1,800 | 2,000-2,200 |
Acceptable Macronutrient Distribution Ranges (AMDR)
Now that you have an idea of how many calories you should consume to maintain your current weight, it’s time to decide how many should come from carbohydrates, protein, and lipids. Remember, these are the only energy (or kcal) providing nutrients. The AMDR is the recommended range of energy intake from carbohydrates, protein, and lipids, expressed as percentages of total daily kcal intake that is recommended for a healthy diet. They can vary widely. For example, one may choose to consume a lower carbohydrate amount (45%) and lipid (20%) but higher intakes of protein (35%). A marathon runner may wish to consume a higher carbohydrate amount (60%), and moderate lipid (20%) and protein (20%). Both of these eating patterns would meet the AMDR recommendations, but the foods consumed may be quite different. No matter the percentages, however, focus on consuming nutrient dense foods.
Table 2.3.3 AMDR Values for Adults
| Energy Providing Macronutrient | AMDR |
| Carbohydrate | 45-65% |
| Lipid | 20-35% |
| Protein | 10-35% |
Examples
How can you determine how many kcal from carbohydrate you should consume in your diet? You can use these steps to calculate your AMDR:
Step 1: Calculate your EER. Let’s say you determined your EER as 1950 kcal a day using the NAM equation provided previously
Step 2: Determine 45% of 1950: 1950 x 0.45 = 877.5 kcal
Step 3: Determine 65% of 1950: 1950 x 0.65 = 1267.5 kcal
Therefore, you should aim for consuming 877.5-1267.5 of your total kcal per day (1950 kcal) from carbohydrates. You would apply the same approach to determine calorie ranges for protein and lipids.
If you want to know the grams of each macronutrient to aim for: divide the kcal you calculated by the kcal per gram for each macronutrient. Let’s use the carbohydrate kcal you calculated in steps 2 and 3 as your goal.
To determine grams of kcal: divide 877.5 kcal and 1267.5 kcal each by 4 kcal/g for carbohydrate, so that would be the equivalent of 219-317 g of carbohydrate per day.
This is a fairly wide range, and the amount you actually consume would vary based on your intake of the other macronutrients. You would do the same calculations using the AMDR for protein and lipids. Then look at the overall recommendations, and based on your goals, choose intakes of the macronutrients that fall within the AMDR.
Dietary Reference Intakes
The AMDR in the previous section provided the recommended kcals from each macronutrient. Recommendations for individual nutrients such as each vitamin or mineral are provided by Dietary Reference Intakes (DRI) which is an umbrella term for the recommendation levels for specific nutrients and consist of a number of different types of recommendations. In addition to EER and AMDR, there are four DRI reference values for specific nutrients:
- Estimated Average Requirements (EAR)
- Recommended Dietary Allowances (RDA)
- Adequate Intakes (AI)
- Tolerable Upper Intake Levels (UL)
The DRIs are not minimum or maximum nutritional requirements and are not intended to fit everybody. They are to be used as guides only for the majority of the healthy population.
DRIs are important not only to help the average person determine whether their intake of a particular nutrient is adequate, they are also used by healthcare professionals and policy makers to determine nutritional recommendations for special groups of people who may need help reaching nutritional goals. This includes people who are participating in programs such as the Special Supplemental Food Program for Women, Infants, and Children (WIC). The DRIs also help to inform Nutrition Facts Labeling on foods and Supplements Facts on supplement labels, and the military uses them to ensure nutrient needs are met for the armed forces. The DRI is not appropriate for people who are ill or malnourished, even if they were healthy previously.
We will discuss how these DRIs are set and how they may be used to help you develop a healthy diet in Chapter 14.
Food For Thought
Do you think it is important for the government to set the DRI standards? Why or why not?
2.4 Personal Choice: The Challenge of Choosing Foods
Different foods affect energy level, mood, how much is eaten, how long before you eat again, and if cravings are satisfied. Food regulates your appetite and how you feel. Multiple studies have demonstrated that some high fiber foods and high protein foods decrease appetite by slowing the digestive process and prolonging the feeling of being full (satiety). The effects of individual foods and nutrients on mood are not backed by consistent scientific evidence, but in general most studies support that healthier diets are associated with a decrease in depression and improved well-being. To date, science has not been able to track the exact path in the brain that occurs in response to eating a particular food, but it is quite clear that foods, in general, stimulate emotional responses in people.
Food also has psychological, cultural, and religious significance, so your personal choices of food affect your body, mind, and soul. The social implications of food have a great deal to do with what people eat, as well as how and when. Special events in individual lives, from births to funerals, are often commemorated with equally special foods. Being aware of these forces can help people make healthier choices, and still honor the traditions and ties they hold dear.
Typically eating kosher foods means a person is Jewish; specifically not eating meat on Fridays during Lent means a person is Catholic; fasting during the ninth month of the Islamic calendar means a person is Muslim. On New Year’s Day, people from New England like to combine pork and sauerkraut as a way to eat their way to luck. Several hundred miles away in the southern US, people eat pork and black-eyed peas, while fish is the “lucky” food of choice for Japanese Americans. National food traditions are carried to other countries when people immigrate. American cuisine would not be what it is today without the contributions of Italian, Chinese, Mexican, and other immigrants.
Factors that Drive Food Choices
Along with these influences, a number of other factors affect the dietary choices individuals make including:
- Taste, texture and appearance. Individuals have a wide range of tastes which influence their food choices, leading some to dislike milk and others to shun raw vegetables. Some foods that are very healthy, such as tofu, may be unappealing at first to many people. However, creative cooks can adapt healthy foods to meet most peoples’ taste.
- Economics. Access to fresh fruits and vegetables may be scant, particularly for those who live in economically disadvantaged or remote areas, where cheaper food options are limited to convenience stores and fast food.
- Early food experiences. People who were not exposed to different foods as children or who were forced to consume every last bite of their vegetables may make limited food choices as adults.
- Habits. It is common to establish eating routines, which can work both for and against optimal health. Habitually grabbing a fast food sandwich for breakfast can seem convenient, but might not offer substantial nutrition. Yet getting in the habit of drinking an ample amount of water each day can yield multiple benefits.
- Culture. The culture in which one grows up affects how one sees food in daily life and on special occasions.
- Geography. Where a person lives influences food choices. For instance, people who live in the midwestern US states have less access to fresh seafood than those living along the coasts.
- Advertising. The media greatly influences food choice by persuading consumers to eat certain foods.
- Social factors. Any school lunchroom observer can testify to the impact of peer pressure on eating habits, and this influence lasts through adulthood. People make food choices based on how they see others and want others to see them. For example, individuals can purchase cheap and fast pizzas or opt for high-end versions at fancy restaurants.
- Health concerns. Some people have significant food allergies to peanuts or shellfish and need to avoid these foods. Others may have developed health issues, which require them to follow a low-salt diet, for example. In addition, people who have never worried about their weight have a very different approach to eating than those who have long struggled with excess pounds.
- Emotions. There is a wide range in how emotional issues affect eating habits. When faced with a great deal of stress, some people tend to overeat, while others find it hard to eat at all.
- Green food/Sustainability choices. Based on a growing understanding of diet as a public and personal issue, more and more people are starting to make food choices based on their environmental impact. Realizing that their food choices help shape the world, many individuals are opting for a vegetarian diet, or if they do eat animal products, striving to find the most “cruelty-free” options possible. Purchasing local and organic food products and items grown through sustainable practices also helps to shrink the size of one’s dietary footprint.
Food For Thought
Which of these influence your food choices? Can you think of any other factors that influence you directly?
Achieving a Healthy Diet
Achieving a healthy diet is a matter of balancing the quality and quantity of food that is eaten. There are five key factors that make up a healthy diet:
- A diet must be adequate, by providing sufficient amounts of each essential nutrient and calories.
- A balanced diet occurs when you do not consume one nutrient at the expense of another, but rather get appropriate amounts of all nutrients.
- Calorie (kcal) control is necessary so that the amount of energy you get from the nutrients you consume equals the amount of energy you expend during your day’s activities.
- Moderation means not eating to the extremes, neither too much nor too little.
- Variety refers to consuming different foods from within each of the food groups on a regular basis.
A healthy diet is one that favors whole foods. As an alternative to modern processed foods, a healthy diet focuses on fresh, whole foods that have been sustaining people throughout the millennia. Whole foods supply the needed vitamins, minerals, protein, carbohydrates, and fats that are essential to good health. Commercially prepared and fast foods are often lacking nutrients and often contain inordinate amounts of sugar, salt, saturated and trans fats, all of which are associated with the development of disease such as atherosclerosis, heart disease, stroke, cancer, obesity, high cholesterol, type 2 diabetes and other illnesses. A balanced diet is a daily variety of foods from the different food groups (vegetables, fruits, grains, protein foods, and dairy).
Adequacy
An adequate diet consists of nutrient dense foods. As discussed in Chapter 1, nutrient dense foods are defined as foods that contain many essential nutrients per calorie. Nutrient dense foods are the opposite of “empty calorie” foods, such as sugary carbonated beverages, which are also called “nutrient poor.” Nutrient dense foods include fruits, vegetables, legumes, lean meats, poultry, fish, low-fat dairy products, and whole grains. Choosing more nutrient dense foods and fewer energy dense foods will facilitate weight loss, while simultaneously providing all necessary nutrients.
Table 2.4.1 The Smart Choice: Nutrient Dense Alternatives
| Instead of…. | Replace with…. |
| Sweetened fruit yogurt | Plain, fat-free yogurt with fresh fruit |
| Whole milk | Low-fat or skim milk |
| Cheese | Low-fat or reduced-fat cheese |
| Bacon or sausage | Canadian bacon or lean ham |
| Sweetened cereals | Minimally sweetened cereals with fresh fruit |
| Apple or berry pie | Fresh apples or berries |
| Deep-fried French fries | Oven baked French fries |
| Fried vegetables | Steamed or roasted vegetables |
| Sugary soft drinks | Unsweetened sparkling water |
| Recipes that call for sugar | Experiment with reduced sugar and added spices (cinnamon, nutmeg, etc) |
Balance
Balance the foods in your diet. Achieving balance in your diet entails not consuming one nutrient at the expense of another. For example, calcium is essential for healthy teeth and bones, but too much calcium will interfere with iron absorption. Most foods that are good sources of iron are poor sources of calcium, so in order to get the necessary amounts of calcium and iron from your diet, a proper balance between food choices is critical. Another example is that while sodium is a vital nutrient, an overabundance of it can contribute to congestive heart failure and chronic kidney disease. Everything must be consumed in the proper amounts.
Moderation
Eat in moderation. Moderation is crucial for optimal health and survival. Burgers, French fries, cake, and ice cream each night for dinner will lead to health complications. But as part of an otherwise healthful diet and consumed only on a weekly basis, this should not have too much of an impact on overall health. If this is done once per month, it will have even less of an impact on overall health. It is important to remember that eating is, in part, about enjoyment and indulging with a spirit of moderation. This fits within a healthy diet.
Calorie (kcal) Control
Monitor food portions. For optimum weight maintenance, it is important to ensure that energy consumed from foods meets the energy expenditure required for body functions and activity. If not, the excess energy contributes to gradual, steady weight gain. In order to lose weight, you need to ensure that more kcal are burned than consumed. Likewise, in order to gain weight, kcal must be eaten in excess of what is expended daily.
Variety
Variety involves eating different foods from all the food groups. Eating a varied diet helps to ensure that you receive all the nutrients necessary for a healthy diet. One of the major drawbacks of a monotonous diet is the risk of consuming too much of some nutrients and not enough of others. Trying new foods can also be a source of pleasure—you never know what foods you might like until you try them.
Developing a healthful diet can be rewarding but be mindful that all of the principles presented must be followed to derive maximal health benefits. For instance, introducing variety in your diet can still result in the consumption of too many high-calorie, nutrient poor foods and inadequate nutrient intake if you do not also employ moderation and Calorie (kcal) control. Using all of these principles together will afford you lasting health benefits.
2.5 Current Eating Patterns in the United States
The typical eating patterns currently consumed by many in the US do not align with the Dietary Guidelines.
- About 75% of the population has an eating pattern that is low in vegetables, fruits, dairy, and healthy oils. Figure 2.5.1 shows that 70-85% of US adults do not consume adequate vegetables and fruits.
- More than 50% of the population is meeting or exceeding total grain and total protein foods recommendations, but are not meeting the recommendations for the subgroups within each of these food groups (ex. whole grains or seafood)
- More than 65% of Americans exceed the recommendations for added sugars, saturated fats, and sodium.
In addition, the eating patterns of many are too high in kcal. Consuming more kcal than one needs over time leads to weight gain. Currently, in the US, more than two-thirds of all adults and nearly one-third of all children and youth are considered either overweight or obese.4
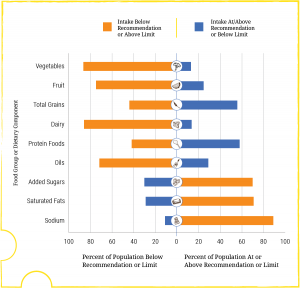
Figure 2.5.1 Note: The center (0) line is the goal or limit. For most, those represented by the orange sections of the bars, shifting toward the center line will improve their eating pattern.4
2.6 Portion Sizes
Have you ever heard the expression, “Your eyes were bigger than your stomach?” Amounts of food can be deceiving to the eye, especially if you have nothing to compare them to. It is very easy to heap a pile of mashed potatoes on your plate, particularly if it is a big plate, and not realize that you have just helped yourself to three portions instead of one.
The food industry makes following the Dietary Guidelines a challenge. In many restaurants and eating establishments, portion sizes and the use of solid fats and added sugars has increased, and consequently a typical meal contains more kcal than it used to. In addition, our sedentary lives make it difficult to expend enough kcal (or energy) during normal daily activities. In fact, more than one-third of adults are not physically active at all.
Dietitians have come up with some good hints to help people tell how large a portion of food they really have. Some suggest using common items such as a deck of cards while others advocate using your hand as a measuring rule.
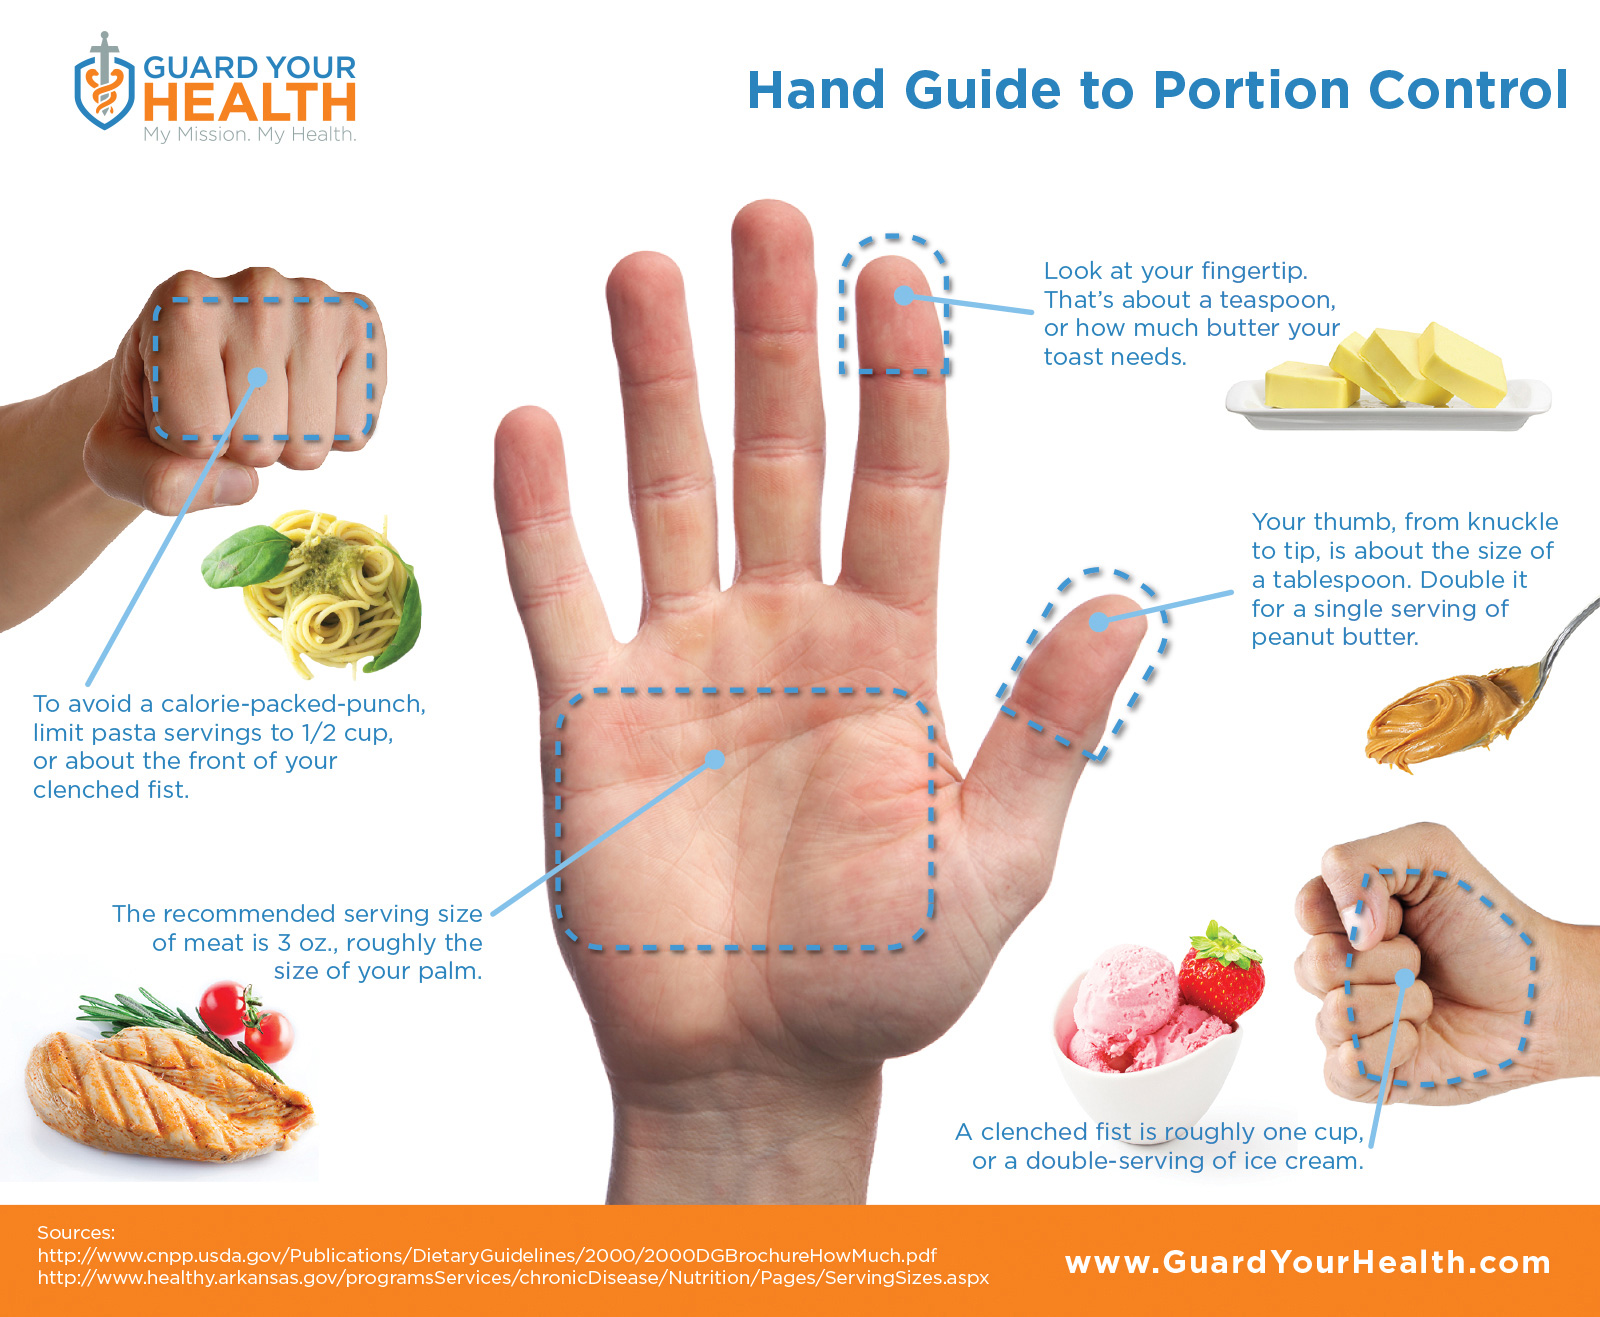
Table 2.6.1 Determining Food Portions5
| Food Product | Amount | Object Comparison | Hand Comparison |
| Raw vegetables, fruit | 1 cup | Baseball | Average-sized closed fist |
| Pasta, rice, oatmeal cooked vegetables | ½ cup | Tennis ball | Small, scooped handful |
| Meat, poultry, fish | 3 oz | Deck of cards | Palm of the hand |
| Nut butter | 1 tbs | Golf ball | Size of the thumb |
| Oil, or other fats | 1 tsp | Postage stamp | Tip of the pointer finger to the first joint |
Estimating portions can be done using the MyPlate Planner. Recall that MyPlate is divided according to how much of each food group should be included.
- Fill half of your plate with vegetables such as carrots, broccoli, salad, and fruit
- Fill one-quarter of your plate with lean meat, chicken, or fish (approximately 3 oz)
- Fill one-quarter of your plate a whole grain such as a ⅓ cup rice
- Choose one serving of dairy
- Add oil during food preparation or at the table such as in salad dressing
Food for Thought
Why is it important to judge portion sizes properly? How often do you think you serve yourself the recommended portion size?
2.7 Food Labeling
Understanding the significance of dietary guidelines and how to use DRIs in planning your nutrient intakes can make you better equipped to select the right foods the next time you go to the supermarket. The food packaging can also provide information that can help you choose wisely.
In the US, the Nutrition Labeling and Education Act (NLEA) passed in 1990 and came into effect in 1994. As a result, all packaged foods sold in the US must have nutrition labels that accurately reflect the contents of the food products. Types of information that are required by law to appear somewhere on the consumer packaging include:
- Name and address of the manufacturer, packager, or distributor
- Statement of identity, what the product actually is
- Net contents of the package: weight, volume, measure, or numerical count
- Ingredients, listed in descending order by weight
- Nutrient information of serving size and daily values
Not all foods in a supermarket will have a label (think fresh produce), but all packaged foods are required to have a Nutrition Facts Label (NFL). The NFL provides a wealth of information about the nutritional content of the product. The information also allows shoppers to compare products. Because the serving sizes are included on the label, you can see how much of each nutrient is in each serving to make the comparisons. Knowing how to read the label is important because of the way some foods are presented. For example, a bag of peanuts at the grocery store may seem like a healthy snack to eat on the way to class. But have a look at that label. Does it contain one serving, or multiple servings? Unless you are buying the individual serving packages, chances are the bag you picked up contains several servings. Recall that moderation and portion control, even of healthful foods, is part of a healthy diet.
According to a 2014 health and diet survey released by the FDA, 79% of first-time buyers of a product will check the food label and will use this information to evaluate fat, kcal, vitamin, and sodium content.7 This is an increase of 25% over data from 2010. The survey also notes that 77% of respondents use food labels always, most of the time, or sometimes when choosing foods. Consumers are also showing an increased awareness of the connection between diet and health. Having reliable food labels is a top priority of the FDA, which has a new initiative to prepare guidelines for the food industry to construct “front of package” labeling that will make it even easier for Americans to choose healthy foods.
In 2016, a new NFL was approved by the FDA, and by July of 2021 all foods must exhibit the new version.
Figure 2.7.1 FDA New Nutrition Facts Label9

Interactive Link: The Food Label and You
The FDA has prepared an Interactive Food Label that is packed with helpful information. You can click on almost any word on the Nutrition Facts Label for guidance.
The first part of the NFL gives you information on the serving size and how many servings are in the container. For example, a label on a box of crackers might tell you that 20 crackers equals one serving and that the whole box contains 10 servings. All other values listed thereafter, from the Calories (kcal) to the dietary fiber, are based on this one serving of 20 crackers. On the panel, the serving size is followed by the number of Calories and then a list of selected nutrients.
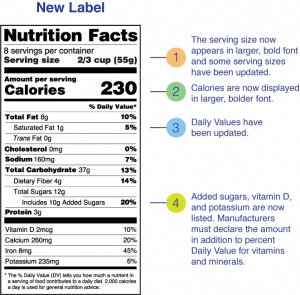
You will also see “% Daily Value” on the far right-hand side. This helps you determine if the food is a good source of a particular nutrient or not. The Daily Value (DV) represents the recommended amount of a given nutrient based on the Recommended Dietary Allowance (RDA) of that nutrient in a 2,000 kcal diet. The percentage of Daily Value (%DV) represents the proportion of the total daily recommended amount that you will get from one serving of the food. For example, in the food label in Figure 2.7.2, the %DV of calcium for one serving of macaroni and cheese is 20%, which means that one serving (2/3 cup) of macaroni and cheese provides 20% of the daily recommended calcium intake in a 2,000 kcal a day diet. Since the DV for calcium is 1,000 milligrams for most adults, the food producer determined the %DV for calcium by taking the calcium content in milligrams in each serving, and dividing it by 1,000 milligrams, and then multiplying it by 100 to get it into percentage format. Whether you consume 2,000 calories per day or not you can still use the %DV as a target reference.
Generally, a %DV of 5% is considered low and a %DV of 20% is considered high. This means, as a general rule for fat, saturated fat, trans fat, cholesterol, or sodium, look for foods with a low %DV. Alternatively, look for a high %DV for fiber, minerals (except sodium) and vitamins. To figure out your fat allowance remaining for the day after consuming one serving of macaroni and cheese, look at the %DV for fat, which is 18%, and subtract it from 100%.
Table 2.7.1 DVs Based on a Caloric Intake of 2,000 Calories (For Adults and Children Four or More Years of Age)10
| Food Component | Daily Value (DV) | Food Component | Daily Value (DV) |
| Total Fat | 78 g | Biotin | 30 mcg |
| Saturated Fat | 20 g | Folate | 400 mcg |
| Cholesterol | 300 mg | Vitamin B12 | 2.4 mcg |
| Sodium | 2,300 mg | Vitamin C | 90 mg |
| Total Carbohydrate | 275 g | Vitamin E | 15 mg |
| Dietary Fiber | 28 g | Vitamin K | 120 mcg |
| Added Sugars | 50 g | Chloride | 2,300 mg |
| Protein | 50 g | Chromium | 35 mcg |
| Vitamin D | 20 mcg | Copper | 0.9 mg |
| Calcium | 1,300 mg | Iodine | 150 mcg |
| Iron | 18 mg | Magnesium | 420 mg |
| Potassium | 4,700 mg | Manganese | 2.3 mg |
| Vitamin A | 900 mcg | Molybdenum | 45 mcg |
| Thiamin | 1.2 mg | Pantothenic Acid | 5 mg |
| Riboflavin | 1.3 mg | Phosphorus | 1,250 mg |
| Niacin | 16 mg | Selenium | 55 mcg |
| Vitamin B6 | 1.7 mg | Zinc | 11 mg |
Of course, this is a lot of information to put on a label, so not all nutrients are required to be listed on all labels. NFLs must list total fat, saturated fat, trans fat, cholesterol, sodium, total carbohydrate, dietary fiber, total sugars, added sugars, and protein, and certain vitamins and minerals (vitamin D, calcium, iron, potassium). Some products are too small to accommodate it all. In the case of small packages, such as small containers of yogurt, candy, or fruit bars, permission has been granted to use an abbreviated version of the NFL.
The NFL provides quite a bit of nutrition information, but sometimes it’s useful to go beyond what the label says to calculate information that may not be listed. For example, the %DV shows how a serving of the product fits into your entire day’s intake, but you may wish to know what percentage of each bite of a single product is sugar or fat. To calculate this:
Step 1: Grams of nutrient x kcal/g of nutrient = kcal from nutrient (recall from Chapter 1 that carbohydrates have 4 kcal/g, protein has 4 kcal/g, lipids/fats have 9 kcal/g)
Step 2: Divide kcal from nutrient by total kcal in a serving of the product
Step 3: Multiply by 100 to convert number to %
PRACTICE!
Let’s do an example using the NFL for macaroni and cheese (Figure 2.7.2). A serving contains 8 g of total fat and 230 kcal.
Step 1: 8 g fat x 9 kcal/g = 72 kcal from fat
Step 2: 72 kcal from fat/230 kcal per serving = 0.313
Step 3: 0.313 x 100 = 31.3% fat*
We could do the same for added sugars, a serving contains 10g added sugars and 230 kcal.
Step 1: 10 g sugar (carbohydrate) x 4 kcal/g = 40 kcal from sugar
Step 2: 40 kcal from sugar/230 kcal per serving = 0.174
Step 3: 0.174 x 100 = 17.4% added sugar*
*So each bite of the macaroni and cheese is 31.3% fat and 17.4% added sugar. The rest of the kcal are coming from complex carbohydrates and protein.
You can use these steps to calculate percentages of kcal from any NFL or the nutrition information for a restaurant meal. For example, if you ate a quarter-pound hamburger with cheese from a fast food restaurant that contained 27 g of total fat and 520 kcal per burger:
Step 1: 27 g fat x 9 kcal/g = 243 kcal from fat
Step 2: 243 kcal from fat/520 kcal per burger = 0.467
Step 3: 0.467 x 100 = 46.7% of the hamburger is fat
Another required section on each food product label is the ingredients list. All ingredients found in a product must be listed by predominance in descending order by weight. In other words, ingredients used in the greatest amount will be listed first, with each additional ingredient listed in descending order. Food additives like colors must also be part of ingredients lists.11
2.8 Claims on Labels and Food Packaging
In addition to mandating nutrients and ingredients that must appear on food labels, the FDA allows food manufacturers to place claims on food packaging to provide additional nutrition related information for consumers. The FDA allows three basic forms of claims: nutrient content claims, health claims, and structure/function claims.12
Nutrient Content Claims
Nutrient content claims describe how much of a nutrient is in a food using consumer-friendly terms such as “high,” “low,” “good source,” or “free.” These words in this context have been defined by the FDA, and in order for a nutrient content claim to be placed on food packaging the food must meet these definitions, and be approved by the FDA. For example, a manufacturer cannot claim that a food is fat-free or low-fat if it is not, in reality, fat-free or low-fat. According to the FDA, the term “low-fat” indicates that the product has three or fewer g of fat, “low salt” indicates there are fewer than 140 mg of sodium, and “low cholesterol” indicates there are fewer than 20 mg of cholesterol and two g of saturated fat per serving of the food based on the serving size listed on the NFL.
Table 2.8.1 Sample Approved Nutrient Content Claims13
| Term | Explanation/Definition |
| High/Excellent Source/Rich in | Contains more than 20% of the nutrient’s DV |
| Good Source/Contains/ Provides | Contains 10-19% of the nutrient’s DV |
| Light/Lite | Contains ⅓ fewer calories or 50% less fat; if more than half of calories come from fat, then fat content must be reduced by 50% or more |
| Free | Contains less than 0.5 g per serving (fat or sugar) |
| Low fat | Product contains 3 g or less fat per serving |
| Calorie Free | Contains less than 5 kcal per serving |
| Low Sodium | Contains 140 mg or less sodium per serving |
Health Claims
Often we hear news of a particular nutrient or food product that contributes to our health or may prevent disease. A health claim is a statement that links a particular food with a reduced risk of developing disease. As such, health claims such as “reduces heart disease,” must be evaluated by the FDA before it may appear on packaging. All health claims must be substantiated by scientific evidence in order for it to be approved and put on a food label. To avoid having companies making false claims, laws also regulate how health claims are presented on food packaging. In addition to the claim being backed up by scientific evidence, it may never claim to cure or treat a disease.
For a detailed list of approved health claims, visit FDA Health Claims.
Qualified Health Claims
While health claims must be backed up by hard scientific evidence, qualified health claims have supportive evidence, which is not as definitive as with health claims. The evidence may suggest that the food or nutrient is beneficial. Wording for this type of claim may look like this: “Supportive but not conclusive research shows that consumption of EPA and DHA omega-3 fatty acids may reduce the risk of coronary artery disease. One serving of [name of food] provides [X] g of EPA and DHA omega-3 fatty acids. [See nutrition information for total fat, saturated fat, and cholesterol content.]”12
Structure/Function Claims
Structure/function claims historically have been found on many “health” foods, dietary supplements, and drugs. They differ from nutrient content and health claims because pre-approval by the FDA to place such a claim on food packaging is not required.
According to the FDA, “Structure/function claims may describe the role of a nutrient or dietary ingredient intended to affect the normal structure or function of the human body, for example, “calcium builds strong bones.” In addition, they may characterize the means by which a nutrient or dietary ingredient acts to maintain such structure or function, for example, “fiber maintains bowel regularity,” or “antioxidants maintain cell integrity.”14 There may NOT be claims of diagnosis, cures, treatment, or disease prevention, and there must be a disclaimer that the FDA has not evaluated the claim. Some companies claim that certain foods and nutrients have benefits for health even though no scientific evidence exists. In these cases, food labels are permitted to claim that you may benefit from the food because it may boost your immune system, for example.
There are also structure/function claims that describe how a product is made or “structured.” Examples of these include claims such as “gluten free.” For product packaging to have this claim, it must meet the definitions set forth by the FDA. Gluten is a protein contained in grains like wheat, rye, and barley that helps make foods like pizza dough stretchy. As will be discussed in Chapter 4, people with celiac disease cannot consume any gluten. Therefore a claim like “gluten free,” or “no gluten” helps these consumers avoid gluten in the products they purchase. Products can use a “gluten free” claim if they meet specific criteria.13
- They cannot have any ingredients that contain gluten or that are derived from gluten-containing ingredients (e.g., wheat flour).
- They can contain an ingredient that has been processed to remove the gluten (e.g., wheat starch), but the food must contain less than 20 mg gluten per kg of the food.
- If wheat is listed in the product’s ingredients, a disclaimer must also appear explaining that “the wheat has been processed to allow this food to meet the FDA requirements for gluten free foods.”
For foods that contain organic ingredients, the labeling is a little different. The USDA certifies that a food product has met strict requirements and has gone through the organic certification process before the USDA Organic symbol may be used. Organic producers use natural, biological, and mechanical farming, but no synthetic substances may be used in production. Organic produce must be grown in soil that has had no prohibited substances (e.g., synthetic herbicides and pesticides) applied for at least 3 years prior to harvest. For organic meats, animals must be raised in conditions mirroring their natural behaviors, be fed only organic feed, and not given any antibiotics or hormones.15
There are 4 distinct labeling categories for organic products:15
- 100% organic: all ingredients must be certified organic with certifying agency listed; 100% Organic USDA seal may be used
- Organic: 95% of ingredients must be certified organic with certifying agency listed; USDA Organic seal may be used
- Made with organic ingredients: at least 70% organic ingredients; seal may not be used
- Specific organic ingredients: less than 70% organic ingredients; can list organic ingredients in ingredient list and percentage used, but may not use “organic” or the USDA Organic Seal
Allergy Warnings
Food manufacturers are required by the FDA to list on their packages if the product contains any of the eight most common ingredients that cause food allergies. These include milk, eggs, peanuts, tree nuts, fish, shellfish, soy, and wheat. (More information on these food allergens will be discussed in Chapter 6). The FDA does not require warnings that cross contamination may occur during packaging, however most manufacturers include this advisory as a courtesy. For instance, you may notice a label that states, “This product is manufactured in a factory that also processes peanuts.” If you have food allergies, it is best to avoid products that may have been contaminated with the allergen.
Date Labels on Foods
According to estimates by the USDA, Americans throw out about a third of our food each year—over 133 billion pounds costing about $161 billion.16 One of the reasons is the multiple types of confusing date labeling terms found on packaged foods. Part of the problem is that date labeling on packaged foods is not user-friendly, and confusion over the multitude of different date labeling terms on food such as “use by,” “sell by,” and “expires on” may contribute to the food loss. The FDA does not require any date labeling on foods except for infant formula. They are working with the food industry to try to standardize the date labeling to make it easier for consumers to understand.17 Table 2.8.2 provides the terms and explanations of the date labeling commonly seen. But even if a food has not passed a “use by” or “sell by” date, foodborne pathogens can still contaminate foods that haven’t been properly stored or handled. On the other hand, even if it has passed a “best if used by” or other date, it does not mean that the food is unsafe to eat. The next chapter will go into more depth about foodborne pathogens and illness.
Table 2.8.2 Date Labeling Explanations
| Term | Explanation |
| Best if Used By/Before | Indicates when a product will be of best flavor or quality; it is not a safety date |
| Sell by | Tells the store how long to display the product for sale or inventory management; typically refers to quality (freshness, taste, consistency); is not a safety date |
| Use by | Last date recommended for the use of the product at peak quality; determined by the manufacturer; is not a safety date except when used on infant formula |
| Guaranteed Fresh | Typically used on bakery items; identifies when food will be at peak freshness; is not a safety date |
Key Takeaways
- The US Dietary Guidelines are based on evolving scientific evidence and are updated every five years. The major recommendations of the 2020-2025 Dietary Guidelines are to follow a healthy eating pattern across the lifespan, customize and enjoy nutrient-dense food and beverage choices that reflect personal preferences, cultural traditions, and budgetary considerations, focus on meeting food group needs with nutrient dense foods and beverages, while staying within kcal limits, and limiting foods and beverages higher in added sugars, saturated fat, and sodium, as well as alcoholic beverages.
- Nutrient intake recommendations set for healthy people living in the US are known as Dietary Reference Intakes (DRIs) and include AI, EAR, RDA, and UL for micronutrients and the AMDR ranges for energy-yielding macronutrients.
- There are numerous factors that influence food choices including taste, habit, health, and/or economic concerns, as well as many others.
- A healthy diet is one that provides adequate and balanced nutrition, provides the necessary amount of energy, utilizes moderation, and incorporates a variety of foods.
- Judging portion sizes can be done using your hand or household objects in comparison. It can also be done using the MyPlate guide to determine how much food is a portion for that meal.
- The Nutrition Labeling and Education Act made it a law that foods sold in the US have a food label that provides specific required information and the accurate contents of nutrients within them. The FDA regulates food labeling including claims.
- A Nutrition Facts Label (NFL) provides information on the amount of servings per container, the amount of calories per serving, and the amounts of certain nutrients expressed as percent daily value (%DV). Generally, a %DV of 5% is considered low and a %DV of 20% is considered high.
- Three types of claims are allowed on food labeling. Nutrient and health claims require FDA approval to be used, structure/function claims do not and are often found on packaged “health” foods.
- There are several dates that can be used on food packaging including “best if used by,” “use by,” and “guaranteed fresh.” These are not safety dates except in the case of infant formula.
Portions of this chapter were taken from OER Sources listed below:
Tharalson, J. (2019). Nutri300:Nutrition. https://med.libretexts.org/Courses/Sacremento_City_College/SSC%3A_Nutri_300_(Tharalson)
Zimmerman, M., & Snow, B. (2012). An Introduction to Nutrition, v. 1.0. https://2012books.lardbucket.org/books/an-introduction-to-nutrition/
Additional References:
- Jahns, L., Davis-Shaw, W., Lichtenstein, A. H., Murphy, S. P., Conrad, Z., & Nielsen, F. (2018). The history and future of dietary guidance in America. Advances in Nutrition, 9(2), 136-147. https://doi.org/10.1093/advances/nmx025
- United States Department of Agriculture. (2011, June). A brief history of USDA Food Guides. Center for Nutrition Policy and Promotion. https://www.choosemyplate.gov/eathealthy/brief-history-usda-food-guides
- United States Department of Agriculture. (n.d.). What is MyPlate? ChooseMyPlate. https://www.choosemyplate.gov/eathealthy/WhatIsMyPlate
- United States Department of Agriculture and United States Department of Health and Human Services. (2020). Dietary Guidelines for Americans, 2020-2025. (9th ed.). https://www.dietaryguidelines.gov
- Ellis, E. (2018, December 18). Serving size vs. portion size is there a difference. Academy of Nutrition and Dietetics. https://www.eatright.org/food/nutrition/nutrition-facts-and-food-labels/serving-size-vs-portion-size-is-there-a-difference
- United States Food and Drug Administration. (2020, August 12). How to understand and use the nutrition facts panel. https://www.fda.gov/food/food-labeling-nutrition
- Chung-Tung, J. A., Zhang, Y., Carlton, E.D., & Lo, S. C. (2016, May 6). FDA health and diet survey: Executive summary. Food and Drug Administration. https://www.fda.gov/media/96883/download
- United States Food and Drug Administration. (2020, February 11). The new nutrition facts label. https://www.fda.gov/food/nutrition-education-resources-materials/new-nutrition-facts-label
- United States Food and Drug Administration. (2020, February 11). How to understand and use the nutrition facts label. https://www.fda.gov/food/new-nutrition-facts-label/how-understand-and-use-nutrition-facts-label
- United States Food and Drug Administration. (2020, May 5). Daily values on the new nutrition facts label. https://www.fda.gov/food/new-nutrition-facts-label/daily-value-new-nutrition-and-supplement-facts-labels
- United States Food and Drug Administration. (2018, Feb 6). Overview of food ingredients, additives & colors. https://www.fda.gov/food/food-ingredients-packaging/overview-food-ingredients-additives-colors
- United States Food and Drug Administration. (2020, May 22). Label claims for conventional foods and dietary supplements. https://www.fda.gov/food/food-labeling-nutrition/label-claims-conventional-foods-and-dietary-supplements
- United States Food and Drug Administration. (2018, September 16). Food labeling guide. http://www.fda.gov/Food/GuidanceRegulation/GuidanceDocumentsRegulatoryInformation/LabelingNutrition/ucm2006828.htm
- United States Food and Drug Administration. (2018, January 12). Authorized health claims that meet the Significant Scientific Agreement (SSA) standard. https://www.fda.gov/food/food-labeling-nutrition/authorized-health-claims-meet-significant-scientific-agreement-ssa-standard
- United States Department of Agriculture. (2017, February 21). Understanding the USDA Organic Label. https://www.usda.gov/media/blog/2016/07/22/understanding-usda-organic-label
- United States Department of Agriculture. (n.d.). Food waste FAQs. https://www.usda.gov/foodwaste/faqs
- United States Food and Drug Administration. (2019, May 23). Working with the food industry to reduce confusion over date labels. https://www.fda.gov/news-events/fda-voices/working-food-industry-reduce-confusion-over-date-labels
the amount of nutrients a food contains relative to the energy it provides
Located on nutrition fact labels, this value represents the percentage of the recommended amount of a given nutrient per one serving of a particular food.
Required on all food labeling; ingredients are listed in descending order by weight in a serving of the product
