Chapter 14: Micronutrients Overview
“Nothing will benefit human health and increase the chances for survival of life on earth as the evolution to a vegetarian diet.”
-Albert Einstein (1879-1955), Physicist
Vitamins and minerals are micronutrients, and by definition, they make up a relatively small part of our diet. Micronutrients are measured in microgram (mcg or µg) or milligram (mg) amounts. Remember that there are 1,000 mg in 1 gram and 1,000 mcg in 1 mg. Those are tiny quantities and yet we can not live without them!
Learning Objectives
- Define bioavailability and list characteristics that affect the bioavailability of micronutrients.
- Discuss the effects of processing on the nutrient content of foods.
- Identify nutrient dense food sources of micronutrients and differentiate between fortified and enriched foods.
- Describe the characteristics of fat- and water-soluble vitamins.
- Describe the characteristics of minerals and how they are classified in nutrition.
- Define each of the Dietary Reference Intakes (DRIs), explain how they are developed, and how they can be used to promote healthy diets.
14.1 General Information about Micronutrients
There are thirteen vitamins and sixteen minerals important to human nutrition, and each serves multiple functions in the body. Entire books have been written about each one, and we could easily spend a whole semester learning about all of these amazing nutrients. But as this is an introductory course, this book will introduce you to the basics.
If you’ve taken a drink of water today, you can thank the minerals that serve as electrolytes, helping to balance fluids in the body. If you’ve taken a breath of air, you can thank the vitamins and minerals that act as antioxidants, protecting vital molecules from free radical damage. If you’ve taken a step, you can thank vitamin D, calcium, and other minerals that make your bones strong. If you’ve moved a muscle, you can thank the many vitamins and minerals that serve as coenzymes and cofactors in metabolic reactions, which unlock the energy contained in nutrients so that your body can use it.
Many vitamins and minerals work together to perform various functions in the body, but are classified based on their chemical characteristics. These characteristics include how we obtain them in our diets, how we absorb and store them, as well as how we experience deficiencies or toxicities when too little or too much is consumed.
Micronutrient Bioavailability
Bioavailability is the amount of a nutrient that is absorbed and subsequently used by the body. Although a particular food may be an abundant source of a micronutrient, not all of the vitamin or mineral may be bioavailable. Many things can influence the bioavailability of a particular micronutrient. Some preparation, cooking, and storage methods may destroy vitamins. Water-soluble vitamins are especially vulnerable to destruction when boiled, overcooked, or with excessive exposure to light. Be sure to store foods properly to avoid nutrient loss. Other factors that influence the bioavailability of micronutrients in foods are the source of the nutrient. Almost always, nutrients naturally found in food are more bioavailable than those found in supplements or fortified foods.
Sometimes the bioavailability of a nutrient has to do more with the person than with the food itself. Some medications may interfere with absorption or metabolism of particular nutrients. Consumption of alcohol or illicit drugs can also modify the bioavailability of nutrients. And underlying health conditions may also play a role. In addition, the genes we inherit from our biological parents can enhance or impede our ability to absorb and use nutrients. Finally, as we age, our ability to absorb and use some nutrients can become impaired.
Table 14.1.1 Overview of Vitamins and Minerals by Primary Function
| Metabolism | Electrolytes | Bones | Blood | Antioxidants | Vision |
| Thiamin (B1) | Sodium | Calcium | Iron | Vitamin E | Vitamin A |
| Riboflavin (B2) | Potassium | Vitamin D | Vitamin K | Vitamin C | Vitamin C |
| Niacin (B3) | Chloride | Phosphorous | Vitamin B6 | Selenium | Vitamin E |
| Pantothenic Acid (B5) | Magnesium | Magnesium | Riboflavin (B2) | Copper | Zinc |
| Vitamin B6 | Calcium | Fluoride | Niacin (B3) | Zinc | |
| Biotin (B7) | Vitamin C | Pantothenic acid (B5) | Manganese | ||
| Folate (B9) | Copper | Copper | |||
| Vitamin B12 | Vitamin K | Zinc | |||
| Iodine | Manganese | Sulfur | |||
| Copper | Folate | ||||
| Zinc | Vitamin B12 | ||||
| Manganese | Vitamin E | ||||
| Chromium | Selenium | ||||
| Molybdenum | Calcium | ||||
| Sulfur |
Effects of Processing on Nutrient Content in Foods
The best way to ensure you are getting all the micronutrients needed for a healthy diet is to eat a wide variety of foods from all food groups. Whole unprocessed foods (e.g., fresh vegetables and fruits, whole grains, lean meats, and low-fat dairy foods) contain more micronutrients than their processed counterparts. For example, a whole baked potato contains significantly more vitamin C, folate, and potassium than a French fry. The nutrient content of foods is typically highest when foods are allowed to ripen on the plant, allowing the plant to full develop the nutrients and phytochemicals it needs to sustain life. Harvesting plants in the peak state of ripeness helps to ensure maximum vitamin and mineral content, and consuming freshly picked or harvested produce usually maximizes nutrient bioavailability. But not all foods can be consumed immediately after harvest. How foods are handled, processed, stored, and prepared can impact how much of that peak nutrient level remains in the food.
Processing of food is an important step in our food supply. Harvesting and transporting foods to communities increases access to a variety of foods. Preservation techniques like canning and freezing extend the shelf life of foods and increase their availability outside of their peak harvest season. In fact, because fresh foods can deteriorate rapidly, food processing techniques may result in better nutrient retention over time when compared to fresh items. However, some vitamins are more stable than others, and the amount retained depends on the specific vitamin and the processing technique. Water-soluble vitamins are the most susceptible to the effects of processing, though other nutrients can be impacted as well.
Table 14.1.2 The Effects of Processing on Nutrient Retention.1
| Method of Processing | Effect on Nutrient Retention | How to Minimize Nutrient Loss |
| Air exposure and time | Enzymes present in foods and exposure to air can destroy nutrients, because as soon as the food is harvested, it begins to slowly decompose. |
|
| Temperature | Cooking helps kill bacteria, makes foods more appealing, and in some situations improves bioavailability of nutrients. But high temperatures for prolonged amounts of time can destroy some vitamins. |
|
| Water | Minerals and water-soluble vitamins can leach into the water. |
|
| Canning | High temperatures may be used, which can destroy water-soluble vitamins, but commercial techniques usually use rapid heating, which helps to reduce nutrient loss. |
|
| Freezing | Freezing does not reduce nutrient content, but if foods are blanched prior to freezing it may slightly reduce levels of water-soluble vitamins. |
|
| Refining of grains | Many B vitamins, minerals, and phytochemicals (as well as fiber), are lost when whole grains are refined (see Chapter 5) |
|
Fortified vs. Enriched
Many consumers think that the terms fortified and enriched mean the same thing. Both are used to describe the addition or enhancement of nutrients in processed foods. However, they are different. A fortified food contains added nutrients that do not naturally occur in the food product. One example is calcium-fortified orange juice. There is very little calcium in an orange, but when food manufacturers fortify the juice with calcium, it becomes a good source of this mineral. Enrichment is the replacement of nutrients lost in processing. In general, the more the food is processed the more nutrients are lost. Not all lost nutrients are replaced. The most commonly enriched foods are flour, rice, farina, pasta, cornmeal, and corn grits. Fortified = added; Enriched = replaced.
14.2 Basic Concepts of Vitamins
Vitamins are essential, noncaloric, organic micronutrients. There is energy contained in the chemical bonds of vitamin molecules, but our bodies do not make the enzymes required to break these bonds to release it. Instead, vitamins serve other essential functions in the body.
The first vitamins were identified over 100 years ago. The name “vitamin” comes from Casimir Funk, who in 1912 thought “vital amines” (similar to amino acids) were responsible for preventing what we know now as vitamin deficiencies. He coined the term “vitamines” to describe these organic substances that were recognized as essential for life, yet unlike other organic nutrients (carbohydrates, protein, and fat) do not provide energy to the body. Eventually, when scientists discovered that these compounds were not amines, the ‘e’ was dropped to form the term “vitamins.”2
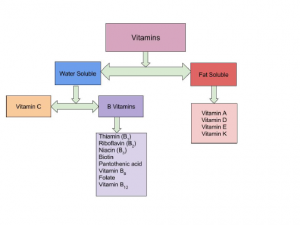
Initially scientists could only classify vitamins based on their solubility. If the vitamin was soluble in fat, it was called vitamin A. If the vitamin was soluble in water it was called vitamin B. As science advanced, it was discovered vitamin A and B were actually several unique organic compounds.2 These new compounds were each given their own letter designation (C, D, E). It was also discovered that vitamin B was actually a group of interrelated substances with similar characteristics but slightly different chemical structures, making them each a unique vitamin. Because of their similarities, the eight B vitamins were each given a number such as B1, B2, B6, B12, but the group is often referred to as B-complex vitamins.3 Why are there missing numbers in the sequence? The B vitamins were numbered in the order in which they were added to the B group, not in the order they were discovered. Over time, some of these were determined to either not fit in the group or were discovered not to be vitamins. Currently thirteen essential vitamins are universally recognized. Some researchers believe there are more vitamins that have yet to be discovered. They are still categorized by their solubility (water- vs fat-soluble), but it is important to note that the term “vitamin” can refer to a number of compounds that all show the biological activity associated with a particular vitamin. For example, “vitamin A” includes the compounds: retinal, retinol, retinoic acid and four known carotenoids. All of these compounds can be converted into active vitamin A in the body.
Vitamins and minerals are found in a wide variety of food items, but there are a few that you may want to make part of your daily diet. Dark leafy greens like spinach, kale, Swiss chard, arugula, bok choy, greens (Collard, dandelion, mustard, etc.), and rapini (broccoli rabe) are tasty and inexpensive. They are nutrient dense and low in calories. A 1 cup serving of raw greens is high in folate, calcium, vitamin A, vitamin C, potassium, vitamin K, and fiber, yet naturally low in sodium and fat. Berries are also highly nutrient dense. A 1/2 cup serving of fresh berries provides a good source of fiber, vitamin C, manganese, vitamin K, antioxidants, and anti-inflammatory flavonoids which are good for the whole body. For an animal source, organ meats like beef liver may be your best bet. A 3 oz serving of liver contains 22 g of protein, and is an excellent source of vitamins A, C, D, most of the B vitamins, iron, magnesium, phosphorus, copper, and zinc. In fact, liver is so nutrient dense that it is recommended that it be consumed no more than once per week as part of a healthy diet, as more frequent consumption could lead to toxicity of fat-soluble vitamins such as vitamin A.
For the most part, vitamins are obtained from food, but a few may also be obtained by other means. For example, microorganisms in the intestine—commonly known as “gut flora” or the “gut microbiome”—produce vitamin K and biotin, while one form of vitamin D is synthesized via the skin with the help of the natural ultraviolet wavelength of sunlight. Humans can produce some vitamins from precursors they consume. Examples include vitamin A, produced from beta carotene, and niacin, produced from the amino acid tryptophan.
Vitamins have diverse biochemical functions. Most of the vitamins have several important functions, not just one. Some vitamins, such as vitamins A and D, have hormone-like functions where they travel through the blood and tell certain cell types what to do. Other vitamins function as antioxidants (e.g., vitamins C and E). The largest number of vitamins, the B vitamins, act as coenzymes and are necessary for enzymes to function, especially in metabolic processes.
Water-Soluble vs Fat-Soluble Vitamins
Solubility determines where vitamins act in the body. Water-soluble vitamins dissolve in water and therefore act in the cytosol of cells or in extracellular fluids such as blood. Fat-soluble vitamins dissolve in fat and are more easily stored in tissue, so the body has access to them as needed.
Another major difference between fat-soluble vitamins and water-soluble vitamins is the way they are absorbed in the body. Vitamins are absorbed primarily in the small intestine and their bioavailability is dependent on the food composition of the diet. Fat-soluble vitamins are absorbed along with dietary fat. Therefore, if a meal is very low in fat, the absorption of the fat-soluble vitamins will be impaired. Fat-soluble vitamins are packaged and incorporated into chylomicrons along with other fatty acids, absorbed into the lacteal within the villi of the small intestine and transported via the lymphatic system to the liver. Water-soluble vitamins are absorbed into the capillaries within the villi of the small intestine walls and are transported in the blood directly to the liver.
Fat-soluble vitamins can be stored in the body’s visceral and subcutaneous fat. Because of this storage capability, it is more difficult for the body to become deficient in some fat-soluble vitamins. However, excessive intake, especially through dietary supplementation or fortification, can cause toxicity. On the other hand, water-soluble vitamins are not readily stored in the body. When someone over-consumes water-soluble vitamins from food (and sometimes dietary supplements), the kidneys filter out the excess and it is excreted in urine. Because of this lack of storage, water-soluble vitamins must be consumed almost every day to avoid deficiency, but toxicity is rare (although can occur with dietary supplementation such as with vitamin B6).
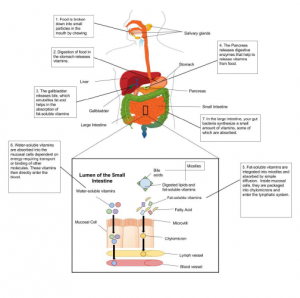
Table 14.2.1 Summary of Differences between Fat-Soluble and Water-Soluble Vitamins
| Characteristics of Water-Soluble Vitamins | Characteristics of Fat-Soluble Vitamins |
| Act in the cytosol of cells or in extracellular fluids such as blood | Protect cell membranes from free radical damage; act within the cell’s nucleus to influence gene expression |
| Absorbed directly into blood | Absorbed into lymph with fats |
| Little to no storage capacity | Large storage capacity in fatty tissues |
| Need to be consumed regularly to prevent deficiency | Does not need to be consumed daily to prevent deficiency (may take months to develop) |
| Toxicity is rare | Toxicity is more likely |
Vitamin Deficiencies
Humans must consume vitamins periodically but with differing schedules to avoid deficiency. The human body’s stores for different vitamins vary widely; vitamins A, D, and B12 are stored in significant amounts in the human body, mainly in the liver, and an adult human’s diet may be deficient in vitamins A and D for many months and B12 in some cases for years, before developing a deficiency condition. However, vitamin B3 (niacin and niacinamide) is not stored in the human body in significant amounts, so stores may last only a couple of weeks. For vitamin C, the first symptoms of scurvy in experimental studies of complete vitamin C deprivation in humans have varied widely, from one month to more than six months, depending on previous dietary history that determined body stores.
Deficiencies of vitamins are classified as either primary or secondary. As discussed in Chapter 1, a primary deficiency occurs when one does not consume enough of the vitamin. A secondary deficiency may be due to an underlying disorder that prevents or limits the absorption or use of the vitamin, due to a “lifestyle factor,” such as smoking, excessive alcohol consumption, or the use of medications that interfere with the bioavailability of the vitamin. People who eat a varied diet are unlikely to develop a severe primary vitamin deficiency. In contrast, restrictive diets, particularly those that eliminate multiple foods or foods groups, have the potential to cause prolonged vitamin deficits, which may result in often painful and potentially deadly diseases.
Well known human vitamin deficiencies involve thiamin (beriberi), niacin (pellagra), vitamin C (scurvy), and vitamin D (rickets). In much of the developed world, such deficiencies are rare; this is due to an adequate supply of food and fortification of vitamins and minerals to common foods.
Can you consume too many vitamins?
As you read about vitamins and their important roles in human health, keep in mind there can be too much of a good thing. These days, many people have access to high-dose vitamin supplements and many processed foods are fortified with several micronutrients. Large doses of vitamin supplements in addition to consumption of high amounts of fortified foods can make it easy to get to toxic amounts of vitamins. Think of vitamins as being on a continuum where you can be deficient (too low), just right, or toxic (too high). If you are just a little deficient you may only be able to detect the deficiency with a blood test but if you are deficient long enough and severely enough, systems of the body will eventually begin to lose function and you will see signs and symptoms overtly. At that stage it is called a “deficiency disease.” If a deficiency disease is caught early enough it can usually be reversed by providing the deficient vitamin, but in some cases the damage that has been done is too severe and cannot be reversed. The opposite is also true. If your intake of a particular vitamin is just a little bit high you may not have any symptoms of the overconsumption. However, if your intake is high enough for long enough, your body may show signs and symptoms of the excess intake, causing a “toxicity disease”.
14.3 Basic Concepts of Minerals
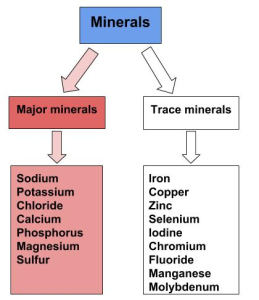
Minerals are inorganic substances in their simplest form that are vital to health and are abundant in our everyday lives. From the soil in your front yard to the jewelry you wear, we interact with minerals constantly. Unlike vitamins which are classified based on their solubility, minerals are categorized by the body’s daily requirements. Major minerals are classified as minerals that are required in the diet each day in amounts larger than 100 mg. There are seven major minerals: calcium, chloride, magnesium, phosphorus, potassium, sodium, and sulfur. Many of these minerals are classified as electrolytes which can separate into charged ions when dissolved. Minor or trace minerals are those needed in amounts less than 100 mg per day. There are nine trace minerals: chromium, copper, fluoride, iodine, iron, manganese, molybdenum, selenium, and zinc. While deficiencies are possible with minerals, consuming a varied diet significantly improves an individual’s ability to meet body needs.
Minerals originate from the earth and are found in food in their simplest form. Living organisms cannot make minerals, so they must be acquired from the diet. Plants obtain minerals from the soil they grow in. Animals (including humans) obtain minerals directly by eating plants, and indirectly by eating other animals that ate the plants. We also get minerals from the water we drink. The mineral content of soil and water varies from place to place, so the mineral composition of foods varies based on geographic location.4
Minerals in food do not require enzymatic digestion. During food digestion they are mechanically split off and absorbed directly into the bloodstream, primarily in the small intestine. Some minerals need the assistance of transport proteins for absorption and transport in blood in a process called facilitated diffusion (see Chapter 4). Minerals are not as efficiently absorbed as most vitamins, and many factors influence their bioavailability:
- Minerals are generally better absorbed from animal-based foods. Plant-based foods often contain compounds that can bind to minerals and inhibit their absorption (e.g., oxalates, phytates).
- In most cases, if dietary intake of a particular mineral is increased, absorption will decrease to maintain homeostasis.
- Some minerals influence the absorption of others. For instance, excess zinc in the diet can impair iron and copper absorption. Conversely, certain vitamins enhance mineral absorption. For example, vitamin C boosts iron absorption, and vitamin D boosts calcium and magnesium absorption.
- As is the case with vitamins, mineral absorption can be impaired by certain gastrointestinal disorders and other diseases, such as Crohn’s disease and kidney disease, as well as the aging process. Thus, people with malabsorption conditions and the elderly are at higher risk for mineral deficiencies.
14.4 Dietary Reference Intakes (DRIs)
In Chapter 2, Dietary Reference Intakes (DRIs) were introduced, but let’s take a deeper dive into how these DRIs are set. Chapter 2 also provided an in depth discussion of the Dietary Guidelines for Americans. DRIs and the Dietary Guidelines are both very useful tools, but provide different information for different audiences. Dietary Guidelines provide qualitative advice to the public about the role of one’s diet in chronic disease prevention and maintaining health. DRIs provide quantitative advice to professionals about amounts of nutrients or food components to be of benefit. Set by the National Academy of Medicine (NAM), DRIs are a common set of reference values for a healthy population based on the relationships between nutrient intakes and health or the prevention of disease.
DRIs are a collective term to refer to these components:
- Estimated Energy Requirement (EER)
- Estimated Average Requirement (EAR)
- Recommended Dietary Allowance (RDA)
- Adequate Intake (AI)
- Tolerable Upper Intake Level (UL)*
*A number of people refer to the UL as simply the “upper limit,” leaving off “tolerable.”
Remember, we previously calculated EER in Chapters 2 and 12. To review, EER is the estimated number of Calories needed to maintain energy (caloric) balance. Using weight as a reference, this means you are taking in no more kcal, and also no fewer kcal, then are needed to maintain that exact weight. To gain weight, you’d need to consume more than your EER, and to lose weight you’d need to consume less than your EER. Unlike some of the other DRIs, EER is individualized and is based on calculations that take into account multiple variables, including an individual’s age, sex, weight, height, and physical activity level.5
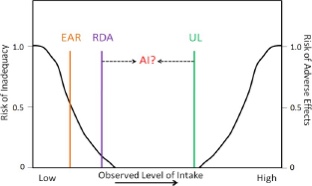
Estimated Average Requirement (EAR) is the nutrient intake level that will meet the average requirement for healthy individuals in an age and sex-specific group. Based on a bell curve, the EAR is set at a level for each nutrient that will meet the requirements for 50% of the population.
The Recommended Dietary Allowance (RDA) is the measure that professionals use to assess the quality of people’s diets. It is set for individual nutrients as the requirement estimated to meet the nutrient needs of 97.5% of healthy people in a population.
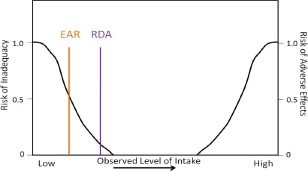
The RDA is calculated using the EAR. Therefore, the EAR needs to be set before an RDA can be set. An EAR is the estimated requirement for 50% of the population (hence the “Average” in its name), as shown in Figure 14.4.1. On the left vertical axis is the risk of inadequacy, and on the bottom of the figure is the observed level of intake that increases from left to right. We will talk about the right axis label in a later figure. Look at where the intake line (black) crosses the EAR and RDA lines in the figure. Where the lines intersect denotes where the level of intake would be inadequate to support the body’s requirements, called the risk of inadequacy. Notice that for the EAR, the risk for inadequacy is 0.5 (50%) whereas the RDA the risk of inadequacy is 0.025 (2.5%).
For nutrients lacking the research evidence needed to set an EAR and thus a RDA, an Adequate Intake (AI) is set instead. An AI is a level that appears to be adequate in a defined population or subgroup. As you can see, the EAR is adequate for 50% of the population and is lower than the RDA. The RDA is adequate for 97.5% of the population, and higher than the EAR. The AI level of intake is believed to be between the EAR/RDA and the UL, but since there is not yet a scientific consensus based on current research, it is not exactly known where this level falls as shown in Figure 14.4.2. AI is a current “best guess” and levels are revisited periodically by scientists who examine new research to determine if the levels should be modified. If, during this reexamination, scientists determine that an EAR can be set, they then set a RDA.
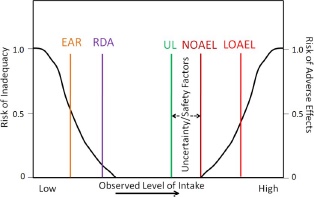
The last of the DRIs is the UL. This is the highest level of daily nutrient intake from all sources (e.g. food, beverages, supplements, fortification) that is unlikely to pose risk of adverse health effects to almost all individuals in the population. To set this, the committee first sets a No Observed Adverse Effect Level (NOAEL) and/or the Lowest Observed Adverse Effect Level (LOAEL). The UL is then set lower (as shown below) based on a number of uncertainty/safety factors, such as natural constituents, substances intentionally and directly added (e.g., food additives), substances indirectly added (e.g., pesticides), and contaminants such as naturally occurring chemicals, industrial products & by-products, and biological agents.6 The right vertical axis is used to represent the risk of an adverse event. Notice the NOAEL at the point where no adverse effects have been reported. The LOAEL is somewhere above the NOAEL. Therefore the UL for a particular nutrient is set at a level where it is believed that people will not experience adverse, toxic effects. In most cases it is difficult to exceed the UL using food alone, but those taking dietary supplements or consuming high amounts of fortified food products should be vigilant.
How are Americans doing in meeting the DRIs? Figure 14.4.4 shows the percentage of Americans that are not meeting the EAR for some of the earlier micronutrients that had DRIs set. Keep in mind that the EAR is set below the RDA.
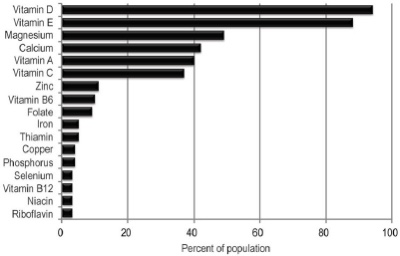
As you can see, a large percentage of Americans do not meet the EAR for vitamins A, D, E, magnesium, and calcium. In the case of vitamin D, for example, more than 95% of Americans don’t even reach the recommended level set for half of the population. This diagram clearly shows that American intakes of these micronutrients are alarmingly low. Also, keep in mind that this diagram does not include micronutrients that have AIs instead of EARs and RDAs.
The USDA has a DRI calculator. Enter your personal data into the calculator, and a list of DRIs for you will be generated.
Table 14.4.1 Summary of DRIs6
| DRI | Definition | Individual or population |
| EER |
Estimated number of kcal needed to maintain current weight |
Calculated using individual characteristics such as sex, height, weight, age, and activity level |
| EAR | Nutrient intake value that is estimated to meet the requirement of half the healthy individuals in a group | Set for a population or group; based on robust scientific research and agreed upon by scientific community |
| RDA* | Average daily dietary intake level that is sufficient to meet the nutrient requirement of nearly all (97.5%) healthy individuals in a group | Individual recommendation based on the population-based EAR |
| AI* | Nutrient intake value based on observed or experimentally determined approximations of nutrient intake by a group (or groups) of healthy people | AI is set when an EAR/RDA cannot be determined |
| UL | Highest level of daily nutrient intake that is likely to pose no risk of adverse health effects to almost all individuals in the general population. As intake increases above the UL, the risk of adverse effects increases. | UL is set only for those nutrients that have possible negative effects when taken in large doses |
*Every micronutrient has either an RDA or an AI.
To review, DRIs are more than numbers in the table, even though that is often how many people view them. They are used in numerous ways:7
- To design and evaluate research studies and results.
- To develop dietary guidelines and food guides.
- RDAs and AIs are used as the basis for %DV on food labeling.
- In diet assessment software that evaluates the adequacy of a person’s diet.
- To plan and track diets for groups like military personnel.
Individuals can use DRIs to help determine if they are consuming enough of a particular nutrient (RDA or AI), or too much if they exceed the UL. They can look at a Nutrition Facts Label on their favorite foods to assess the food’s contribution to their nutrient intake. They may be using them without even knowing if they use a nutrition or fitness app that helps them track their dietary intakes. These values are used widely to plan and assess nutrient intakes of healthy people. Being familiar with how they are developed and applied is an essential part of understanding nutrition concepts. Appendix 3 contains the tables that many people commonly associate with the DRIs.
Key Takeaways
- There are 13 vitamins that are organic micronutrients classified by their solubility in fat or water and needed in very small amounts.
- Most micronutrients come from whole foods like fruits, vegetables, meats, legumes, nuts, and seeds, but some vitamins can be made by microorganisms in our intestines.
- Micronutrients have diverse biochemical functions.
- The bioavailability of nutrients is affected by cooking, preparation, storage, medication, the age or health condition of the person, and consumption of medications, illicit drugs, or alcohol.
- Fortified foods have nutrients added, enriched foods have replaced some nutrients that were lost in processing.
- There are differences between fat-soluble and water-soluble vitamins in how they are absorbed, where they work in the body, where and if they are stored, and how easy it is to become deficient in the vitamin.
- Minerals are inorganic micronutrients categorized as major or trace based on how much the body requires daily. Some like sodium, chloride, and potassium, are electrolytes which means they can separate into charged ions when dissolved.
- There are two types of deficiencies of micronutrients: primary and secondary. Primary occurs because of lack of intake while secondary occurs because of an underlying disorder or lifestyle factor that affects bioavailability.
- It is possible to consume excessive amounts of micronutrients from dietary supplements and/or fortified foods. At very high levels (above the Tolerable Upper Limit or UL) this can cause toxicity conditions that can be harmful.
- Dietary Reference Intakes (DRIs) are a common set of reference values (EAR, RDA, AI, UL) for a healthy population based on the relationships between nutrient intakes and health or the prevention of disease. They have a wide variety of uses.
Portions of this chapter were taken from OER Sources listed below:
Callahan, A., Leonard, H., Powell, T. (2020). Nutrition: Science and Everyday Application. https://openoregon.pressbooks.pub/nutritionscience/
Jellum, L., Hitzeman, J., Krauss, M., Henderson, S., Harnden, T., Elsberry, C., & Ford, G. (2018). Principles of Nutrition Textbook, Second Edition. Nursing and Health Sciences Open Textbooks. 5. https://oer.galileo.usg.edu/health-textbooks/5
Tharalson, J. (2019). Nutri300:Nutrition. https://med.libretexts.org/Courses/Sacremento_City_College/SSC%3A_Nutri_300_(Tharalson)
Titchenal, A., Calabrese, A., Gibby, C., Revilla, M.K.F., & Meinke, W. (2018). Human Nutrition. University of Hawai’i at Manoa Food Science and Human Nutrition Program Open Textbook. https://pressbooks.oer.hawaii.edu
Additional References:
- Devi, R. (2015). Food processing and impact on nutrition. Scholars Journal of Agricultural and Veterinary Sciences, 2 (4A), 304-311. http://saspjournals.com/wp-content/uploads/2015/08/SJAVS-24A304-311.pd
- Carpenter, K. J. (2003). A short history of nutritional science: Part 2 (1885-1912). Journal of Nutrition, 133, 975-84.
- Carpenter, K. J. (2003). A short history of nutritional science: Part 3 (1912-1944). Journal of Nutrition, 133, 3023-32
- Linus Pauling Institute: Micronutrient Information Center. (2020). Minerals. https://lpi.oregonstate.edu/mic/mineral
- Gerrior, S., Juan, W., & Peter, B. (2006). An easy approach to calculating estimated energy requirements. Preventing Chronic Disease, 3(4), A129.
- Institute of Medicine Food and Nutrition Board. (1998). Dietary reference intakes: A risk assessment model for establishing upper intake levels for nutrients. National Academies Press (US). https://pubmed.ncbi.nlm.nih.gov/20845565/
- US Department of Health and Human Services. (2020, April 2). Dietary reference intakes (DRIs). Office of Disease Prevention and Health Promotion. https://health.gov/our-work/food-nutrition/dietary-reference-intakes-dris
Media Attributions
- Mineral Classification
The amount of a substance that is absorbed, transported, and subsequently used in the body
Nutrients added to a food product that would not naturally occur in that product.
Replacement of nutrients that are lost with food processing.
fat located in and around body organs
directly beneath the skin; subcutaneous fat is located here
being "toxic" or poisonous - able to cause damage to the body
nutrient deficiency caused by inadequate intake
Adequate intake of a nutrient occurs, but for some reason the body cannot use it so deficiency signs and symptoms occur.
Atoms that can separate into charged ions when dissolved.
