Loudness perception
44 Frequency and loudness perception
Loudness perception (and frequency)
Amplitude plays the dominant role in loudness perception. If a sound is played at 50 dB and then the same sound is played at 70 dB, our brains interpret the 70 dB sound as louder. However, frequency also plays a role in loudness perception- a 70 dB tone at 1000 Hz and a 70 dB tone at 16,000 Hz will not be perceived as equally loud, even though the intensities are the same. (For most people, the 1000 Hz version will seem much louder). Our ears are especially sensitive to sounds with frequencies between 300 Hz to 3000 Hz. This is fortunate- most human speech takes place in this frequency band. Our ears are far less efficient at frequencies outside this band.
Equal loudness curves
Hearing tests can be used to construct equal loudness contours. The listener compares tones at different frequencies and is asked to adjust the amplitude of one of the tones until the two tones sound equally loud. To see how it’s done, take your own hearing test using the tool on the “Music Acoustics” website at the University of New South Wales. For best results, you will need good quality over-the-ear headphones. The URL is
http://newt.phys.unsw.edu.au/jw/hearing.html.
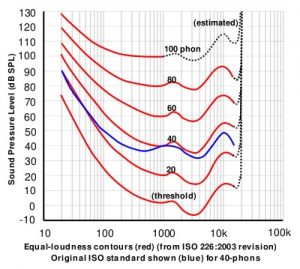
The figure at the right (taken from https://en.wikipedia.org/wiki/Equal-loudness_contour) shows the typical frequency response of the human ear. This frequency plot and ones like it are sometimes called equal loudness contours or Fletcher-Munson curves (after the researchers who did groundbreaking research on the perception of loudness). Frequency is plotted along the x-axis and sound level is plotted on the y-axis. Each curve on the graph represents sounds with equal perceived loudness.
The bottom curve represents all sounds at the threshold of human hearing. Points along this trace are barely perceptible for most people. Barely noticeable sounds at low frequency must have a high sound level to be heard (70 dB for 20 Hz). Similarly, sounds above 10 kHz must be quite intense to be noticed. By contrast, the center of the graph shows that sounds near 1000 Hz don’t have to have be very intense to be heard. Notice that the ear is especially sensitive to sounds near 3,500 Hz- this is due to resonance of air in the ear canal.
Equal loudness curves are the basis of a unit of loudness called the phon. The phon is an attempt to put a unit on human perception of loudness of pure tones. Sounds on the same equal loudness curve have the same number of phons.
Stop to think 1
Which sounds louder to most people: a 50 Hz tone with a sound level of 70 dB, or 1,000 Hz tone with a sound level of 70 dB ?
Stop to think 2
Which sounds louder to most people: a 50 Hz tone at 40 phon, or 1,000 Hz tone at 40 phon?
Sound level meters and weighting
Equal loudness curves play a role in sound level meters. Since loudness is not measurable, engineers who design sound level meters transform the data picked up by a microphone into a number that reflects the overall loudness of a sound for most listeners. Sound meters use a technique called weighting to compensate for the fact that some frequencies sound louder than others. Weighting uses equal loudness curves to put more emphasis on frequencies humans hear well while downplaying the role of other frequencies play in the overall intensity. A-weighting is the most common scheme, but many experts prefer C-weighting. Weighted sound level measurements are often indicated by a capital letter following the decibel symbol- like dB-A or dB(A) for A-weighting.
Stop to think answers
- The 1,000 Hz tone will seem far louder than the 50 Hz tone for most people, even though the sound levels are identical. Humans have far better hearing near 1000 Hz than at low frequencies like 50 Hz.
- Both will sound equally loud to most people- by design, all sounds with the same number of phons will sound about equally loud to most people.
