Ruba Al-zqebah1, Florian Hoffman2, Jochen Deuse1,2, Nick Bennett1 and Lee Clemon1
1 Centre for Advanced Manufacturing, University of Technology Sydney, Australia.
2 Institute of Production Systems, TU Dortmund, Germany
ruba.Al-zqebah@student.uts.edu.au
Keywords: Discrete Event Simulation, Digital model, Plant simulation, Woolsheds, Optimization.
1. Introduction
Discrete Event Simulation (DES) are a common approach in the search for improvements to production systems. They are used in various industrial sectors and are a basis for optimisation. So far, production simulations have found limited use in the wool industry. This study aims to use DES to compare the performance of different wool shed layouts (curved vs linear) using Siemens Plant Simulation software for Australian wool sheds. The digital model revealed that the curved layout showed better performance than the linear layout. Adding an extra skirting table enhanced the production for both arrangements. The paper shows how improvements in this industry can be identified and evaluated using DES.
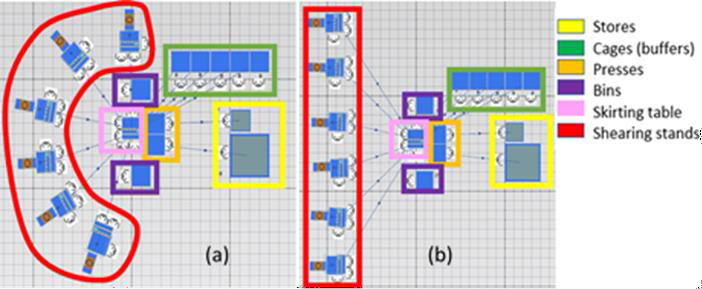
Shearing sheds’ design not only affects human and animal safety inside the shed but also plays an important role in the amount and quality of harvested wool. Wool shed designs vary by shearing stand arrangement, board position, and size depending on the number of workers, skirting tables, wool presses, and location of wools bins. Traditionally wool sheds would conform to what we term a “linear” layout (see Fig. 1). However, recent research from Australian Wool Innovation has proposed an alternative layout [1], which we call “curved” (Fig. 1). This research uses DES to simulate the two current competing shearing shed arrangements and compare their performance.
2. Methodology
To visualise the current production process and compare the performance of the two sheds layouts, a digital model has been developed using Tecnomatix Plant Simulation. Fig.1.a represents the developed model for the curved layout which consists of six shearing stands (arranged in a curve), a skirting table located in the center, surrounded by two bins on each side, two wool presses followed the skirting table, five cages and stores. While Fig. 1.b represents the same shed but with the shearing stands arranged linearly.
3. Results and Discussion
The output of the production line was 826 fleeces in the curved layout and 815 fleeces in the linear layout. Statistical analyses of work at each workstation showed that this difference is a consequence of an increase in the shearers being blocked by the skirting table, as indicated by the increased ‘yellow’ portions in Fig. 2b, compared to Fig. 2a. and that refers to the workers experience approx. 30% drop in distances travelled with the curved shed layout, meaning they are more often ready to receive fleeces from the shearer and deliver them to the wool table without delays.
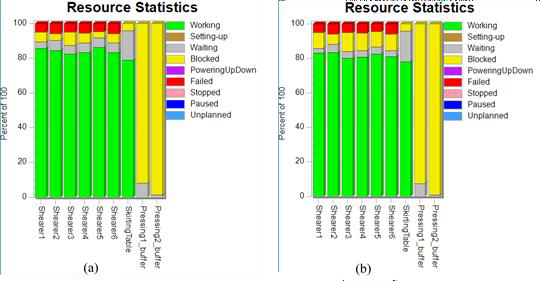
(b) Linear shed layout
Despite the curved layout reduced the blocking, both layouts still suffer from a bottleneck created by the presence of a single wool table.
The suggested solution to increase flow capacity is to add another skirting table and one extra worker The simulation model for this solution showed satisfying effects, as it raised the production to 856 fleeces of wool within 7:40 hours. The blocking percentage and blocking time in the curved layout after this addition decreased tragically.
Although the bottleneck in the wool shed was somewhat evident from the experimental data gained from shed observation. DES was a straight-forward and low cost route to generate and evaluate potential solutions. The associated layout changes enable an increase in employee productivity and thus an increase in the output of the production system.
4. Conclusion
This study used DES to compare the performance of different wool shed layouts (curved vs linear) using Siemens Plant Simulation software.
The digital model revealed that the curved layout showed better performance than the linear layout by an increase in output of 11 fleeces over a one-day working period (equivalent to 33 min saving). The underpinning reason was the reduction in travelling time for workers in the curved layout, which helped to reduce the blocking at the skirting table. Adding a second skirting table decreased the blocking problem in both layouts. That meant the shearers could work at their near full capacity, leading to an improvement in both layouts, as the production enhanced from 815 to 846 fleeces in the linear layout, and from 826 to 856 fleeces in the curved layout.
The paper shows how improvements in this industry can be identified and evaluated using DES. Through further simulation-based investigation of the wool harvesting process, an optimised production layout could be designed and examined with regard to its potential for improvement. This approach eliminates the need for costly replanning, which is usually associated with high investment costs that may ultimately be unsuccessful.
Reference
- Australian Wool Innovation Ltd. Shearing Shed Design. 2019; Available from: https://www.wool.com/people/shearing-sheds-and-sheep- yards/shearing-shed-design/.
