Aitor Orue1, Aitor Lizarralde1, Unai Apaolaza1 and Álvaro García2
1 Mondragon Unibertsitatea, Loramendi 4, 20500 Mondragón (Spain)
2 Baobab Soluciones and Universidad Politécnica de Madrid, Madrid (Spain)
Keywords: Theory of constraints, protective inventory, protective capacity.
1. Introduction
The main idea of the theory of constraints (TOC) is that the performance of every system is limited by at least one constraint. This constraint has been the basis for system management and improvement [1].
Using the TOC–drum-buffer-rope (DBR) methodology, Lizarralde et al. [2] developed a systematic decision-making process that systematised the first two stages in the DBR approach. This new formulation of the methodology has provided a strategic perspective for the selection and exploitation of bottlenecks (BN).
To continue the implementation process initiated by Lizarralde et al. [2], it was essential that the influence and interrelationship of the key factors (i.e., protective capacity and protective inventory) in Step 3 of the TOC–DBR in various environments be understood and analysed.
2. Objectives
The aim of the study was to analyse the influence of protective capacity and protective inventory in the implementation of Step 3 of the TOC–DBR methodology in MTS environments. Thus, a discrete event simulation was used to address the following research question:
What is the influence of protective capacity and protective inventory on the operative performance of Step 3 of the TOC in MTS environments?
Operative performance can be measured in several ways. In this study, the objective is that BN is working at 100% and has material to process; thus, the BN starvation percentage was used.
3. Simulation model
The system under analysis is a flow-shop workshop, with six workstations where all parts are processed at every single stage and share the very same route. The system, which was modelled with Simio software, operated according to the specific assumptions in order to simulate its behaviour in an MTS environment. The variability was attributed mostly to the manufacturing process rather than demand, given that operations were based on the need to meet the forecasts.
4. Results
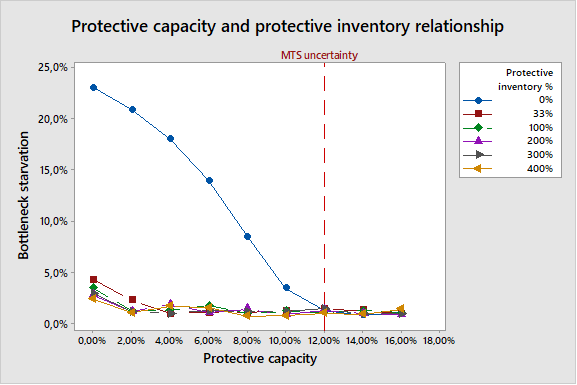
The general results are illustrated in Fig. 1, which shows the relationship between protective capacity and protective inventory in relation to BN starvation. The points in the figure represent the average of the five replicate experiments.

References
- E. M. Goldratt and J. Cox, The goal. A process of ongoing improvement., 3rd ed. North River Press, 2004.
- A. Lizarralde, U. Apaolaza, and M. Mediavilla, “A strategic approach for bottleneck identification in make-to-order environments: a drum-buffer-rope action research based case study,” J. Ind. Eng. Manag., vol. 13, no. 1, pp. 18–37, 2020.
