10.5 Process Analysis Example
In this section, we delve into numerical problems related to process design, illustrating how to evaluate and optimize operations through quantitative analysis. We’ll start with a practical example from a bakery to understand the dynamics of process flow, capacity, and utilization.
Problem 1: Three-Step Bread Making Operation
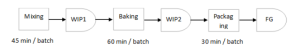
Consider a bakery with a bread-making operation divided into three sequential steps. The first step is mixing, requiring 45 minutes per batch. The second step is baking, taking 1 hour (60 minutes) per batch. The final step is packaging, which takes 30 minutes per batch. Given a single 8-hour shift, our task is to calculate the maximum number of batches that can be processed, the cycle time for the operation, and the utilization rates for the mixing, baking, and packaging stages when operating at full capacity.
Solution:
To solve this, let’s break down the requirements:
Maximum Number of Batches in an 8-hour Shift:
- Since each step of the process must be completed for a batch before moving to the next, the bottleneck (the slowest step) determines the maximum number of batches. In this case, the baking step is the bottleneck, as it takes the longest time (1 hour per batch).
- An 8-hour shift contains 480 minutes (8 hours * 60 minutes/hour).
- Dividing the total available time by the bottleneck step’s duration gives the maximum number of batches: 480 minutes / 60 minutes per batch = 8 batches.
Cycle Time:
- The cycle time is defined by the bottleneck step since it’s the longest duration in the process sequence, which is 1 hour or 60 minutes in this scenario.
Utilization of Each Stage:
- Mixing Stage Utilization: Given that mixing takes 45 minutes and we can only process 8 batches due to the bottleneck, the mixing stage is actively used for 360 minutes (45 minutes * 8 batches). Therefore, its utilization is 360 minutes used / 480 minutes available = 75%.
- Baking Stage Utilization (Bottleneck): This stage is used for the full shift to process 8 batches, totaling 480 minutes. Hence, its utilization is 480 minutes used / 480 minutes available = 100%.
- Packaging Stage Utilization: Packaging takes 30 minutes per batch. For 8 batches, this stage is used for 240 minutes. Thus, its utilization is 240 minutes used / 480 minutes available = 50%.
Answer Summary:
The maximum number of batches that can be made in one shift of eight hours is 8.
The cycle time for the bakery operation is determined by the baking step, which is 60 minutes.
The utilization rates for each stage when working at full capacity are 75% for mixing, 100% for baking, and 50% for packaging.
This example underscores the importance of identifying the bottleneck in a process to determine its capacity and highlights how the utilization rate of each stage can vary, impacting the overall efficiency of the operation.
Relevance of such problems
This calculation is crucial for a bakery for several reasons, impacting both its operational efficiency and financial health:
- Identifying the Bottleneck: Understanding which step in the process is the slowest (in this case, baking) allows the bakery to pinpoint where improvements are needed. Addressing the bottleneck can lead to higher throughput, enabling the bakery to produce more bread in the same amount of time, thereby increasing potential sales and revenue.
- Capacity Planning: Knowing the maximum number of batches that can be produced in a shift is essential for capacity planning. It helps the bakery to forecast production levels accurately, manage inventory more effectively, and ensure that there is enough product to meet customer demand without overproducing, which can lead to waste.
- Utilization Rates: Understanding the utilization rates of different stages of the process helps in resource allocation. For example, if the mixing and packaging stages have lower utilization rates, it might indicate that there is excess capacity at these stages that could be optimized. The bakery could potentially start preparing ingredients for the next batch while the current batch is baking, thus better utilizing the time and labor available.
- Cost Management: Efficiency in each process step can significantly impact the cost structure of the bakery. For instance, a 100% utilization rate of the baking stage suggests that ovens are in continuous use, which might maximize energy use but also points to a limit in production capacity. Understanding these dynamics helps in making informed decisions about investments in additional resources or equipment to increase capacity or reduce costs.
- Quality Control: Cycle time and process analysis can also influence the quality of the bread. Ensuring that each step has sufficient time not only for production but also for quality checks is essential to maintaining high standards. Adjusting the process based on capacity and utilization insights can help balance efficiency with quality.
- Strategic Decision Making: Lastly, these calculations provide valuable data for strategic decision-making. They can inform discussions about expanding production capacity, extending product lines, or optimizing existing processes for better profitability.
In summary, the insights gained from analyzing the bread-making process in terms of maximum batches, cycle time, and utilization rates are pivotal for a bakery’s operational strategy, enabling it to operate more efficiently, meet market demand effectively, and make informed decisions to drive business growth.
10.5.1 Understanding Little’s Law
Little’s Law is a fundamental principle in queueing theory, widely applicable in various fields such as manufacturing, logistics, and service operations. It provides a simple yet powerful way to understand the relationship between three key aspects of any stable system: the average number of items in the system (L), the average rate at which items arrive or are processed (λ), and the average time an item spends in the system (W). Little’s Law is elegantly summarized as:
L= λ×W
This means the average number of items in the system (L) is equal to the product of the average arrival rate (λ) and the average time each item spends in the system (W). The beauty of Little’s Law lies in its generality; it applies to any system, stable over time, regardless of the arrival process distribution, service distribution, or the number of servers in the system.
Applications of Little’s Law
Understanding Little’s Law is crucial for process analysis and improvement, as it allows managers to predict how changes in one aspect of the system (like processing speed or arrival rate) could impact the overall system performance. It’s particularly useful in identifying bottlenecks, estimating work-in-process inventory, and improving customer waiting times.
Problem 2: Bakery Production Line
Consider a bakery where the average rate of bread batches processed is 5 batches per hour. If the average time a batch spends in the production process from mixing to packaging is 2 hours, calculate the average number of batches in the production process at any given time.
Solution:
Applying Little’s Law, L=λ×W, where:
- λ = 5 batches/hour (arrival rate)
- W = 2 hours (time in the system)
L= 5×2 = 10 batches
This means there are, on average, 10 batches of bread in the production process at any given time.
Problem 3: Customer Service Queue
A customer service center processes an average of 120 calls per day. If the average time a customer spends on the phone, including waiting time, is 10 minutes, calculate the average number of calls in the system (waiting or being processed) at any given time.
Solution:
First, convert the arrival rate to match the time unit used for the average time in the system. There are 1440 minutes in a day, so:
λ = 120 calls/day
= 120/1440 = 0.0833 calls/minute
W = 10 minutes
Applying Little’s Law,
L = λ × W:
L = 0.0833 × 10 = 0.833 calls
This means there are, on average, approximately 0.833 calls in the system at any given time.
Problem 4: Online Retail Order Processing
An online retail company processes an average of 600 orders per day. At any given time, there are typically 150 orders either being processed or waiting in the queue. Calculate the average time an order spends in the system.
Solution:
To find the average time an order spends in the system (W), we rearrange Little’s Law to solve for W, giving us:
W = λ /L
First, convert the processing rate (λ) to match the unit used for L (orders in the system). Since we’re dealing with a daily rate:
λ = 600 orders/day
L = 150 orders
Using Little’s Law:
W = L/ λ
= 150 / 600 day/order
To convert this into a more understandable unit, like hours per order, remember that 1 day = 24 hours
W = 150 / 600 × 24 hours/order = 6 hours/order
This means, on average, an order spends 6 hours in the online retail company’s processing system, from the time it’s placed until it’s fully processed. This insight can help the company assess its order processing efficiency and identify potential areas for reducing processing time, thereby improving customer satisfaction.
In summary, this section has provided a comprehensive look at process analysis through the exploration of cycle times and the application of Little’s Law, equipping readers with essential tools for evaluating and optimizing operations across diverse contexts. By understanding the intricacies of cycle times, we can pinpoint efficiency bottlenecks, while Little’s Law helps in quantifying the flow and duration of processes, offering invaluable insights for enhancing productivity and operational effectiveness. These analytical approaches are pivotal in guiding businesses toward streamlined operations and improved performance, showcasing the practical value of process analysis in achieving operational excellence.
