8.5 Special Topics in Inventory Management
8.5.1 ABC Analysis
Inventory management is not just about ensuring that you have enough stock to meet demand, but also about managing the costs associated with holding and monitoring that inventory. Different inventory items can have different levels of importance and cost implications for a business. This is where the ABC analysis comes into play.
In reorder point systems, inventory levels are continuously monitored. As soon as the inventory reaches the reorder point, a new order is placed. This continuous monitoring ensures that stock levels are always optimal, but it comes at a cost. The administrative effort, technology, and manpower required to keep a constant check on inventory levels can be significant. On the other hand, periodic systems involve checking inventory levels at regular intervals, say once a week or once a month. This reduces the monitoring costs since the inventory is only checked periodically. However, the challenge here is to ensure that stock levels remain adequate between these checks.
Given the costs associated with continuous monitoring in reorder point systems, it makes sense to reserve such intensive monitoring for items that have high inventory holding costs or in other word items with a high value of usage. For items that are less expensive or less critical, periodic monitoring might be more cost-effective.
ABC Analysis of Inventory Management:
Inventory management involves managing a large number of items, even for medium-sized companies. Therefore, it is not possible to use the same control measures for all items. It is more appropriate to differentiate items based on the effort required to manage them versus the benefits derived.
The Pareto Law, also known as the 80/20 rule, can be applied to inventory items. This means that approximately 20% of the items in inventory account for 80% of the total inventory value. Additionally, 50% of the items account for less than 5% of the total inventory value. This information can be used to classify inventory items into three categories: A, B, and C.
 The ABC analysis is a method used to classify inventory items based on their value of usage. For instance, if a component costs $8 per unit and the firm anticipates using 750 units of that material in the next year, the value of that material is $8 x 750 = $6,000.
Based on the ABC analysis, inventory items are classified into three categories:
- A Items: These are high-value items. Typically, about 20% of items contribute to approximately 80% of the inventory value. Given their high value, they are monitored closely and frequently. A items should have a higher level of safety stock than B items or C items. This is because A items are the most important items and they have the biggest impact on the business if they are out of stock.
- B Items: These are medium-value items. Roughly 30% of items contribute to around 15% of the inventory value. They are monitored less frequently than A items but more frequently than C items. B items should have a lower level of safety stock than A items, but still higher than C items. This is because B items are still important to the business, but they are not as critical as A items.
- C Items: These are low-value items. They might represent about 50% of the total items but account for just 5% of the inventory value. Given their lower value, they are monitored the least frequently. C items can have a lower level of safety stock, or even no safety stock at all. This is because C items are the least important items and they have the smallest impact on the business if they are out of stock.
For example, a company sells a variety of groceries, including milk, salt, and steaks. Milk is a high-value item, so it would be classified as an A item. Salt is a low-value item, so it would be classified as a C item. Steaks are a medium-value item, so they would be classified as a B item.
The company would keep a high level of safety stock for milk, a medium level of safety stock for steaks, and a low level of safety stock for salt. The company would also monitor and manage the inventory levels of each item on a different schedule.
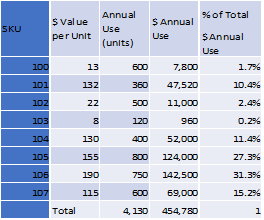
Another example: Which SKU is most likely to be classified as Class A? Class C?
 Another example: Refer to the table below. According to the ABC inventory classification method, the most likely candidates for classes A and C are, respectively:
| Item # | Current Inventory (units) |
Unit Cost ($) |
Current Inventory Value ($) |
Classification |
| 1 | 2,100 | 6.50 | ||
| 2 | 460 | 25.30 | ||
| 3 | 205 | 17.00 | ||
| 4 | 4,300 | 7.25 | ||
| 5 | 190 | 16.40 |
- item 5 is class A, item 2 is class C
- item 3 is class A, item 4 is class C
- item 4 is class A, item 5 is class C
- item 1 is class A, item 3 is class C
By classifying items into these categories, businesses can allocate their inventory monitoring resources more effectively. High-value items get the attention they require, while lower-value items are monitored in a more cost-effective manner. In essence, the ABC analysis allows businesses to prioritize their inventory management efforts, ensuring that they get the best return on their investment in inventory monitoring. Additionally, ABC analysis offers a number of benefits, including:
- Improved inventory accuracy
- Reduced stockouts
- Lower inventory costs
- Improved customer service
- Increased profitability
By classifying inventory items into three categories and applying different management strategies to each category, businesses can improve their overall inventory management process.
8.5.2 Risk Pooling
Risk pooling is a powerful concept in inventory management and is the underlying phenomenon that enables online marketplaces to offer similar or even superior service levels compared to traditional brick-and-mortar stores, despite the inherent uncertainties of online demand. At its core, risk pooling is about consolidating risks. In the context of inventory management, it refers to the reduction in the variability of demand (and hence safety stock) when demands from multiple locations are aggregated. Instead of managing inventory separately for each individual location, risk pooling suggests consolidating inventory in a central location. This centralization allows for a more efficient response to variations in demand across different locations.
For instance, consider two retail stores in different cities. If one store experiences higher than expected demand, while the other experiences lower than expected demand, the two extremes can offset each other when inventory is pooled at a central location. This reduces the overall variability in demand and, consequently, the amount of safety stock required.
The Square Root Law:
To quantify the benefits of risk pooling, we can use the square root law. Let’s consider a numerical example:
Suppose a single store requires a safety stock of 100 units to achieve a desired service level. Now, if we have 4 such stores (with independent demands), and if we were to manage inventory separately for each store, the total safety stock required would be 4 x 100 = 400 units.
However, if we pool the risks and centralize the inventory, the safety stock required is not simply the sum of the safety stocks of the individual stores. Instead, it’s determined by the square root rule:
Safety Stock (Centralized) = x SS
Where
N = number of stores in the original configuration
SS = safety stock in each store in the original configuration
In our example,
Safety Stock (Centralized) = √4 x 100 = 200 units
By centralizing the inventory, we’ve effectively halved the safety stock requirement, showcasing the power of risk pooling.
In essence, risk pooling leverages the law of large numbers to reduce the variability in demand, allowing businesses to maintain high service levels with less inventory. This is especially beneficial for online marketplaces that cater to a wide geographical area, as they can centralize their inventory and still meet the diverse demands of their customer base efficiently.
8.5.3 Postponement
One of the most illustrative examples of the concept of postponement in inventory management can be seen at home improvement giants like Home Depot and Lowe’s. These stores have introduced tinting centers where customers can select almost any shade of paint they desire. Instead of stocking cans of every possible color – a logistical and inventory nightmare – these stores stock large quantities of base paints. When a customer selects a specific color, the base paint is then tinted to that exact shade on the spot.
This approach has multiple advantages:

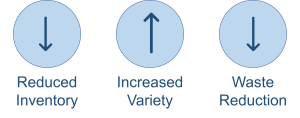
- Reduced Inventory: The stores don’t need to maintain inventory for every possible color, which would be vast and costly.
- Increased Variety: Customers have access to a virtually unlimited palette of colors, enhancing their shopping experience.
- Waste Reduction: Unsold cans of specific colors can lead to waste. With tinting centers, the base paint is a versatile resource that can be turned into any color as per demand.
Typically, offering a higher variety implies a need for higher inventory to maintain the same service levels. However, with the tinting center approach, these stores have managed to break this trade-off, offering high variety without the associated high inventory levels.
Definition of Postponement:
Postponement refers to the strategy of delaying the final activities in the product manufacturing or distribution process until customer preferences are known. The goal is to delay the point of differentiation as late as possible to minimize the uncertainties associated with forecasting specific product variants.
Types of Postponement:
- Labeling Postponement: Products are manufactured in a generic form and labeling is done later based on market requirements. For instance, electronic goods might be produced generically and labeled for specific markets or retailers later.
- Manufacturing Postponement: Here, the manufacturing of the final product is delayed until an order is received. For example, a computer manufacturer might assemble a PC based on individual customer specifications.
- Packaging Postponement: Products are packaged in final form only after receiving the order. This is common in industries where bulk products are split into customer-specific orders.
- Time Postponement: Products are shipped to a central location in anticipation of orders. Once orders are received, they are then shipped to the final destination. This is common in online retail where goods are stored in central warehouses.
By adopting postponement strategies, businesses can reduce inventory costs, improve service levels, and respond more flexibly to market demands.