1.2 An Organizational View to Data-Driven Decision Making
In this section of the chapter, we want to discuss how data-driven approaches operate within an organization. Figure 1.1 proposes a generic view of an organization, relating different organizational levels to their main decision-making processes and data needs. As the figure suggests, we can imagine an organizational model that involves three major levels: operational, managerial and strategic. All three levels have information needs and make decisions to perform their work. Operational levels require more detailed data and with higher levels of precision, and as we move up to the managerial or strategic levels, less volume and precision is necessary to make decisions. Although it may sound counterintuitive at first, the following example will help to clarify the apparent paradox.
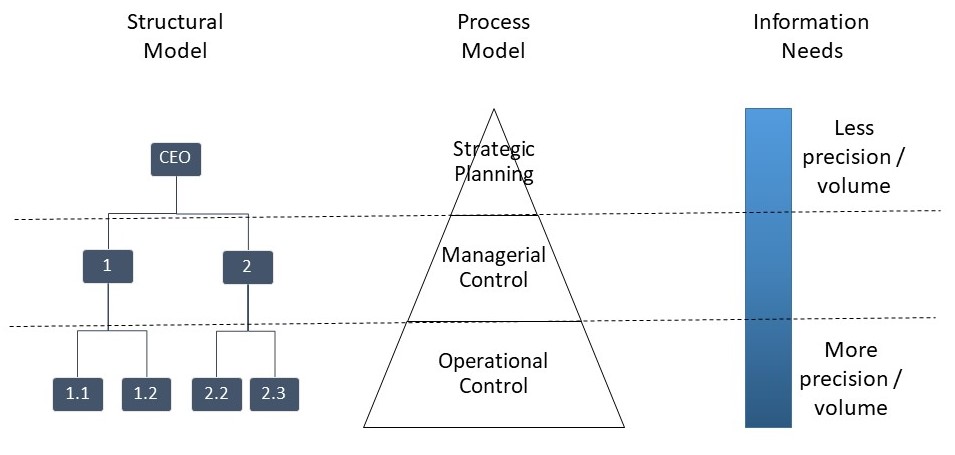
Figure 1.1. An organizational view of Data and Information needs.
Think about the policy area of child protective services. To make this example more concrete, let’s use the case of the ChildStat system in New York City. Caseworkers and their immediate supervisors represent the operational level of this policy area, borough directors represent the managerial level, and city directors and the Commisioner represent the strategic level. Caseworkers research in the field to discuss and solve the cases, capturing it into their field notes. However, field notes are not the only data used by caseworkers to improve performance. They also use additional data about children and their families coming from other information systems. Caseworkers work closely with a supervisor to discuss specific problems of each case. Caseworkers report some of their notes in the case management system and other database systems. Although borough directors may intervene in specific cases, they do not go into the detail of each case when they meet with supervisors. They only need an overall picture of workloads and progress among the caseworkers in their borough. Finally, strategic managers in the city mostly use trends and very aggregated data to make decisions about the overall system.
Data and information is used differently at each level and also with different levels of detail. To better illustrate those levels of aggregation of data, let’s take into account the following 4 data reports that are used to assess performance within this system: (1) ChildStat PowerPoints, (2) ChildStat booklets, (3) ChildStat case reviews, and (4) ChildStat case summary analyses. The data of the first two reports focus exclusively on performance indicators, and the next two concentrate on information about an individual case investigation. The ChildStat PowerPoints and ChildStat booklets are prepared by data analysts. The analyst receives approximately 15-20 automated reports from the Information Technology (IT) division weekly and then uses a spreadsheet to create graphs and visuals. Both the PowerPoint and booklets contain the same information, in the same graphical presentation format, but are disseminated through different media. Figure 1.2 includes one of the figures in these reports. It takes a singular performance metric – ‘case load’ – and presents it through many different visualizations. Each visualization provides a slightly different perspective on the performance metric case load – depicting it over time as a trend, as different averages based on zone, borough, or system-wide. These two reports are likely the most useful at the strategic level.
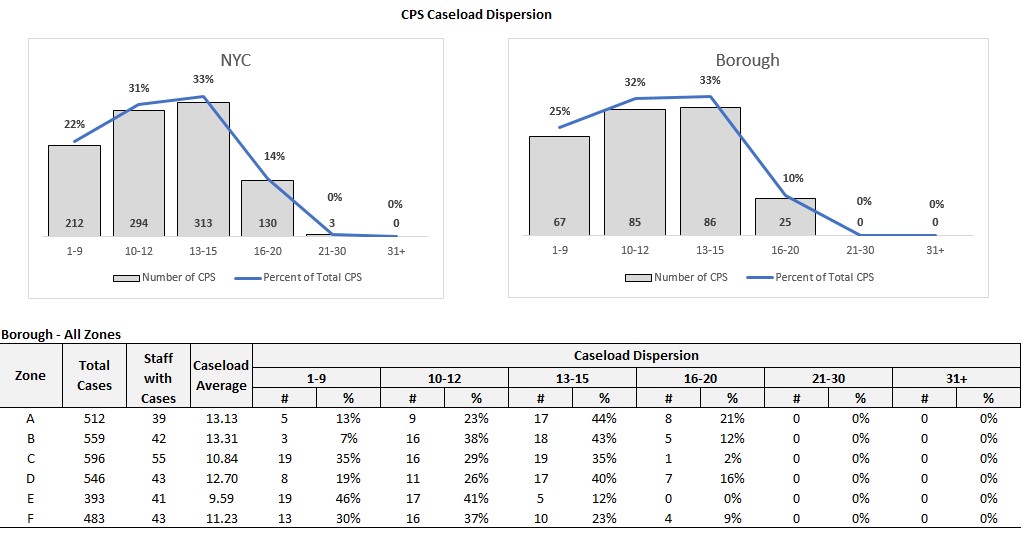
Figure 1.2 Caseload report from the Childstat Powerpoint (Adapted from Luna-Reyes et al., 2019
The ChildStat case review is a summarized report of one case investigation created by an analyst on the basis of the electronic case record and other available databases (i.e. child protection databases, preventive services, foster care, and adoption databases, income support, etc.). The review details the step-by-step actions that the caseworker and supervisor documented about the case. Basic contextual information about the borough, caseworker and supervisor tenure, and demographic information about the child and the family are provided. The ChildStat case summary analysis, also prepared by an analyst on the basis of electronic records, is a list of bulleted, one- to two-sentence explanations, of what was done on the case, what the strengths and weaknesses of the case were, whether the caseworker captured the ‘bigger picture’ of what was happening with this child and family, and suggestions for things that could have been done differently. These two reports are likely the most useful at the operational level.
Although beyond of the scope of this chapter, these different views to performance information and their interpretation at different levels within the organization, has proven to be a difficult task, making communication and performance improvement very challenging. One caseworker describes such difficulty: “I don’t get to use [the ChildStat booklet information] a lot because my level of involvement doesn’t require me to have much of the information about this. To tell you the truth, I’m more about my supervisor supporting what I have to do. Rather than, you have 10 [cases], and you are gonna get another one and that will be 11. To me, that would distress me more than him/her saying, how about we work on this and move that.” Managerial levels play an important role in translating the vision into operational language, as well as communicating important performance details to the strategic levels. Here is the view of one supervisor: “Yes, I think these statistics mean something to us, but our role is different. When I bring it to my workers [I tell them], ‘you got the lowest number of cases, but you don’t have the highest number of this [compliance rate], your compliance rate should be wonderful.’ I think that brings it to them, because [it makes them think] why would I have just 5 cases, which [should] be good, but [their] compliance rate on safety assessments is like 70 percent, what is going on? I think some of the [caseworkers] will look at me and say, ‘yeah she’s right.’”
On the other hand, the types of decisions that need to be made at each level, their level of uncertainty and the models that can be used are also different. As suggested in Figure 1.3, decision problems are highly unstructured at the strategic levels, meaning that strategic problems have not clear questions as starting points, goals are fuzzy, it is not always evident what data is needed to solve them or what procedures are necessary to analyze. Moreover, in most cases there is no a single answer and judging the value of the answer will most likely be dependent on the goals of different stakeholders. As decision become more structured, there is more agreement on the questions, the data and the methods, and also more agreement on what constitutes a correct answer. Considering the case of the child protective services, it may seem reasonable to assume that –eventhough working with children is a delicate and complicated matter– case workers have agreement on the goals of their work as well as the processes and protocols to follow in each case. It is also likely that they share a common understanding of the relevant “signs” (data points) to respond to a case in different ways. As we move up in the organization and think on the overall system, designing a strategy solve the long-term problem of having children at risk becomes even more difficult, and although case by case, it is possible to solve individual problems, it is less clear if we will be able to follow a strategy that reduces the number of overall cases to a minimum, and most likely will require collaboration with other organization in the public, private and nonprofit sectors.
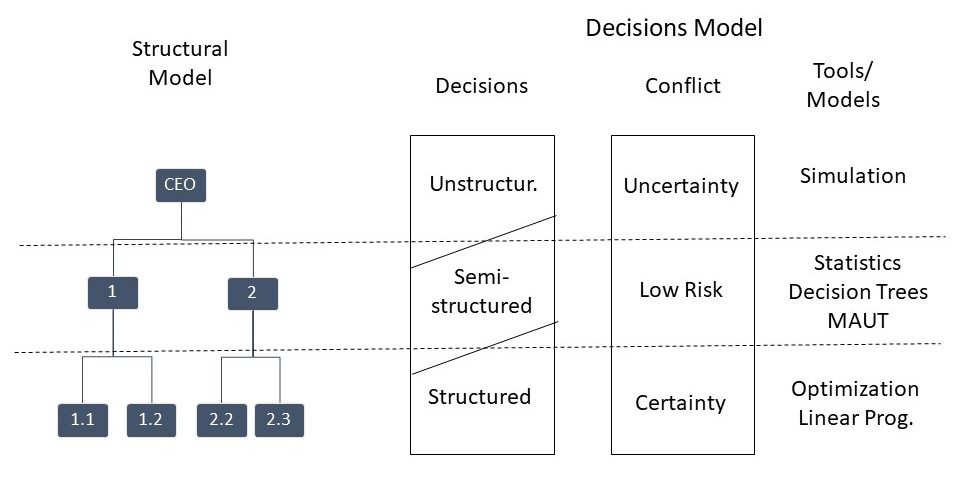
Figure 1.3 Uncertainty, decisions and decision models within the organization.
Similarly, the levels of uncertainty will vary across organizational levels, increasing as we move up in the organizational structure. Finally, different types of models can be used at different levels in the organization. We will explore in the modeling section of this book all the ones listed in Figure 1.3 with the only exception of statistics, which is treated in many other textbooks.
Further Reading
- Luna-Reyes, L. F., N. Helbig and X. Yerden* (2021). “Performance Information Artifacts: Boundary Objects to Facilitate Performance Dialogue” International Journal of Public Administration in the Digital Age 8(1):1-16
Attribution
By Luis F. Luna-Reyes, and licensed under CC BY-NC-SA 4.0.
