11.4 Dealing with Uncertainty
Using Scenarios to manage Uncertainty
Although all previous examples are not considering uncertainty, MAUT models include the use of scenarios to explore uncertainty under different potential futures. A full MAUT model will look like Figure 11.11, which includes scenarios I, II and III as potential uncertain futures. Uncertainty exists when, given our understanding of a problem, there are many possible future states of nature (scenarios). It is important to note that scenarios to be considered in a MAUT model analysis are not on the control of the decision maker, but depending on random, uncertain events. Economic fluctuations, political turmoil or natural disasters are common factors affecting potential future states in the context of public management and public policy.
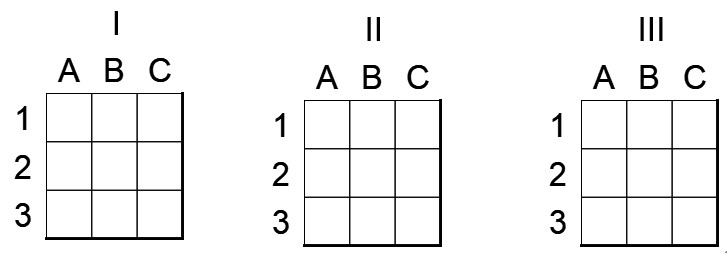
Figure 11.11 A MAUT Model with Three Scenarios
Figure 11.12 shows the warming-up problem considering 4 potential scenarios. It is common to include the Status Quo as a basic scenario in any MAUT analysis, implying that the expectation of no change in the future is always a potential scenario. In our running example, an increase of 20% in the number of cases, the discovery of a new treatment or a combination of both are potential scenarios included in the analysis. Although all elements in the model can be changed, the analysis included in the figure only adjusts the values of the weights for each scenario. In this model, the status quo assumption (scenario I) is that all three criteria have the same weight. When increasing the number of cases (scenario II), decision makers in this example increased the weight on efficiency, giving much less importance to the percentage of error and the price of the test. When a new treatment is discovered as a potential future (scenario III), decision makers in the example weighted in a more important way the percentage of error, giving less weight to the efficiency and the proce of the test. Finally, when both uncertain events happen at the same time (scenario IV), decision makers in the example weight equally efficiency and percentage of error, giving no weight to the price per test.

Figure 11.12 Flu MAUT Model with 4 scenarios.
Under these scenarios and weights, Valora appears to be the best option for Scenarios I and II; Prueba for scenario III and Valora and Prueba are both equal in terms of total utility under scenario IV. In the next section we will propose three alternate ways of using this model to choose the best option using the preferences to risk of the decision maker.
Criteria to Assess Uncertainty
Decision criteria to assess the MAUT model under uncertainty are the same that we introduced for the case of decision trees. We will use an optimistic (or maximax) approach for decision makers that are willing to take risks, we will suggest a pesimistic approach (or maximin) for decision makers that are averse to risk, and a subjective approach for decision makers that are neutral to risk.
When applying the maximax criteria, we will focus in the highest value for each alternative for all 4 scenarios. In Figure 11.13, the table in the top represents the use of this decision criteria. We have copied and pasted the total utilities for each alternative under all four scenarios. For each alternative (column), we highlight the highest value from the 4 scenarios (rows). There will be one highlighted cell per alternative. The recommendation will be the alternative with the highest highlighted value, the best of the maximum values. It is optimistic in the sense that an optimistic decision maker will expect the best possible thing to happen, and the best possible thing to happen is to choose Valora under scenario II, which results in the best possible utility value.

Figure 11.13 Decision Criteria Under Uncertainty
The pesimistic decision maker will prefer to use the maximin criteria to use this information. In this case, for each alternative (column), we highlight the lowest value from the 4 scenarios (rows). There will be one highlighted cell per alternative. The rule is to choose the maximum value among this lowest (or minimum) utilities (the highest highlighted value). It is a pesimistic approach given that the pesimistic decision maker will alway expect the worse to happen, and Evalua is in this case the best option among all three. Finally, the subjective criteria involves adding all utility values for the 4 scenarios for each alternative. Each alternative (column) has one “total” score, in the last row. Select the alternative with the highest total utility across all 4 scenarios.
Attribution
By Luis F. Luna-Reyes, Erika Martin and Mikhail Ivonchyk, and licensed under CC BY-NC-SA 4.0.
