10.5 Sequential Decisions
In addition to dependent uncertainties, real business decisions often include sequential decisions. This section considers an example that demonstrates how to address sequential decisions.
Example 1.8 ABC Computer Company
ABC Computer Company is considering submission of a bid for a government contract to provide 10,000 specialized computers for use in computer-aided design. There is only one other potential bidder for this contract, Complex Computers, Inc., and the low bidder will receive the contract. ABC s bidding decision is complicated by the fact that ABC is currently working on a new process to manufacture the computers. If this process works as hoped, then it may substantially lower the cost of making the computers. However, there is some chance that the new process will actually be more expensive than the current manufacturing process. Unfortunately, ABC will not be able to determine the cost of the new process without actually using it to manufacture the computers.
If ABC decides to bid, it will make one of three bids: $9,500 per computer, $8,500 per computer, or $7,500 per computer. Complex Computers is certain to bid, and it is equally likely that Complex will bid $10,000, $9,000, or $8,000 per computer. If ABC decides to bid, then it will cost $1,000,000 to prepare the bid due to the requirement that a prototype computer be included with the bid. This $1,000,000 will be totally lost regardless of whether ABC wins or loses the bidding competition.
With ABC s current manufacturing process, it is certain to cost $8,000 per computer to make each computer. With the proposed new manufacturing process, there is a 0.25 probability that the manufacturing cost will be $5,000 per computer and a 0.50 probability that the cost will be $7,500 per computer. Unfortunately, there is also a 0.25 probability that the cost will be $8,500 per computer.
A decision tree for this situation is shown in Figure 10.7. First, ABC must decide whether to bid and how much to bid. If ABC s bid is lower than Complex Computer s, then ABC must decide which manufacturing process to use. If ABC uses the proposed new manufacturing process, then the cost of manufacturing the computers is uncertain. The net profit figures (in millions of dollars) shown at the endpoints of the Figure 10.7 tree take into account the cost of preparing the bid, the cost of manufacturing the computers, and the revenue that ABC will receive for the computers. For example, examine the topmost endpoint value. It costs $1 million to prepare the bid, and ABC bids $9,500, which is lower than Complex Computers bid of $10,000, and hence ABC wins the contract. Then the proposed new manufacturing process is used, and it costs $8,500 per computer to manufacture the 10,000 computers. Therefore, at this endpoint, ABC makes a net profit of -1,000,000-(10,000 X $8,500) + 10,000 X $9 500 = $9,000,000 = $9 million. Verify the net profits shown at the other endpoints so that you better
understand this process.
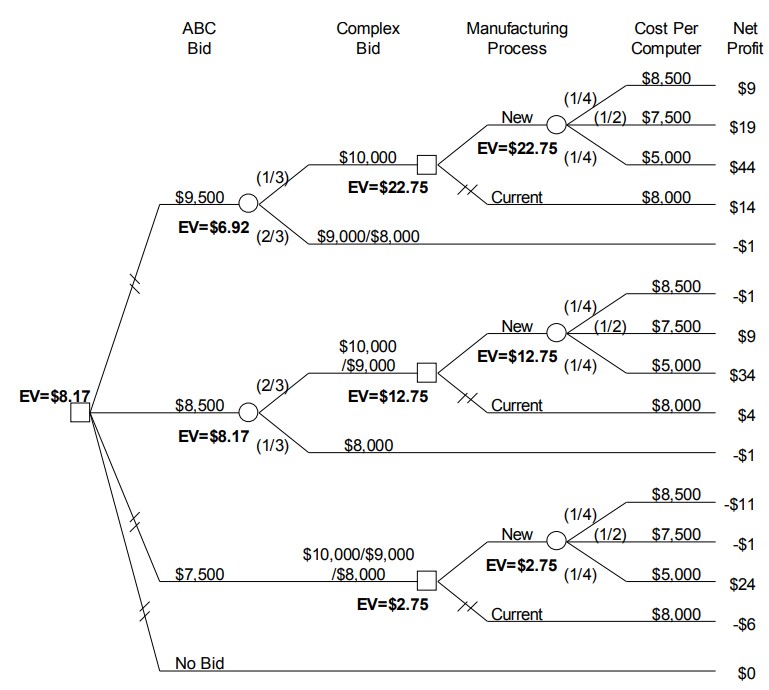
Figure 10.7 ABC Computer Company decision tree, with net profit in millions of dollars
Calculating the expected values shown on the Figure 10.7 decision tree requires addressing a new issue, namely what to do when there are multiple decision nodes in the tree. In this decision, the amount of the bid is the first decision, and if this is lower than the Complex Computers bid, then there is a second decision involving the type of manufacturing process to use. The calculation procedure for this situation is a straightforward extension of the calculation procedure that was demonstrated in the preceding section for dependent uncertainties.
This procedure will be illustrated by considering the topmost set of nodes in the Figure 10.7 tree. Start at the rightmost side of the tree, and calculate the expected value for the top rightmost chance node. This is determined as [latex]\frac{1}{4}[/latex] X $9 + [latex]\frac{1}{2}[/latex] X $19 + [latex]\frac{1}{4}[/latex] X $44 = $22.75. At the top rightmost decision node, compare the expected values for the two branches. The expected value for the top branch of this decision node is $22.75, and (since there is no uncertainty regarding the cost of the current manufacturing process) the expected value for the bottom branch is $14. Since the top branch has the higher expected value, it is the preferred branch. That is, the proposed new manufacturing process should be used. Hence, the expected value for the manufacturing process decision node is equal to the expected value for the proposed new manufacturing process, which is $22.75.
Now continue back toward the root of the decision tree by calculating the expected value for the top leftmost chance node in the tree. Since the expected value of the manufacturing process decision is $22.75, and there is no uncertainty about the net profit if ABC loses the bid, the expected value for the top leftmost chance node is [latex]\frac{1}{3}[/latex] X $22.75 + [latex]\frac{2}{3}[/latex] X (-$1) = $6.92. A similar process is used to calculate the expected values for the other three branches of the root node, and the results are shown in Figure 10.7. These calculations show that an $8,500 bid has the highest expected value, which is $8.17 million. Hence, if ABC uses expected value as its decision criterion, then it should bid $8,500. In addition, the calculations also show that ABC should use the proposed new manufacturing process if it wins the contract. The less preferred branches for each decision node have been indicated on the decision tree with cross hatching.
The complete specification of the alternatives that should be selected at all decision nodes in a decision tree is called a decision strategy.
Definition 10.5: Decision Strategy
Attribution
By Craig W. Kirkwood, Chapter 1 of Decision Tree Primer, January 11, 2013, licensed under a Creative Commons Attribution License CC BY-NC-SA 4.0.
