T1.1 Exploring and Downloading Data into Excel
Learning Objectives
- Understand what the data represent
- Identify anomalies
- Generate questions
The Crain’s Report was developed with the SPARCS dataset. The Statewide Planning and Research Cooperative System (SPARCS) contains data about all inpatient hospital discharges in New York, recording each hospital visit in an “All-payer” database. The dataset includes patient demographics, length of stay, procedures performed, diagnoses, and financial information. The dataset is historically available through special data use agreements, but a de-identified “open data” version are now publicly available on Health Data NY. Data journalists used these data to identify major disparities in the cost of hip replacements.
Exploring the SPARCS dataset in SOCRATA.
Socrata is one of the most popular platforms to publish Open Data. You already have used Socrata exploring Helath Data NY in the Scavenger Hunt. It is the application that you used to see data elements in a tabular form.

To explore the SPARCS dataset in Socrata,
- go the Health Data NY website following the URL: https://health.data.ny.gov, or google “Health Data NY”
- Type “SPARCS 2014” into the search bar

- Select “Hospital Inpatient Discharges (SPARCS De-Identified): 2014” Dataset

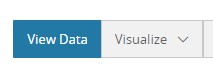
- Click on View Data
- Explore both the Data and Meta Data and think about the following questions
| Question | Your Answer |
| Which data elements are included? |
|
| How were these data collected? |
|
| Why were these data collected? |
|
| What do these data represent? |
|
| What are the uses that you could give to this Dataset? |
|
Downloading SPARCS into Excel.
The SPARCS dataset is very large. Although we could not call this dataset Big Data, it is large enough to make Excel and your computer very slow. In this way, we are going to download only the Hip’s related data in this dataset. Follow the instructions from SOCRATA (the tabular view of SPARCS dataset – there is also a video in Blackboard that shows the same procedure):
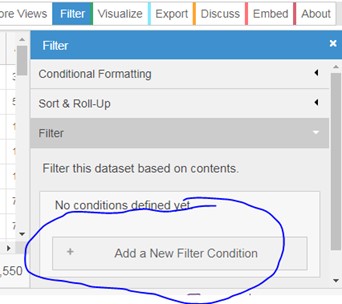
- Click “Filter”

- Click on “Add a New Filter Condition”
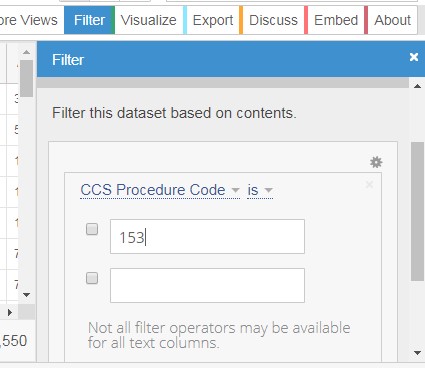
- Select “CCS Procedure Code”

- Set procedure code to 153 and hit “Enter” in your keyboard. These numbers are standard medical billing codes; the same codes are used throughout the US by all medical facilities. The code 153 is for Hip Replacement.
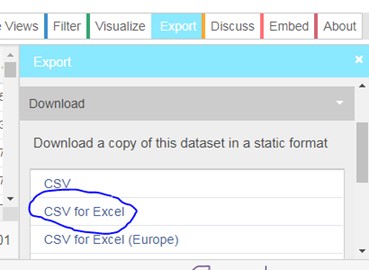
- Click on “Export”
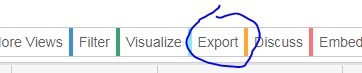
- Download as “CSV for Excel”
- Depending on the browser that you are using, different things may happen. You may get a dialogue box where you need to select “Open with Microsoft Excel,” or you may get the file in the status bar of the browser. Anyways, open it with Excel.
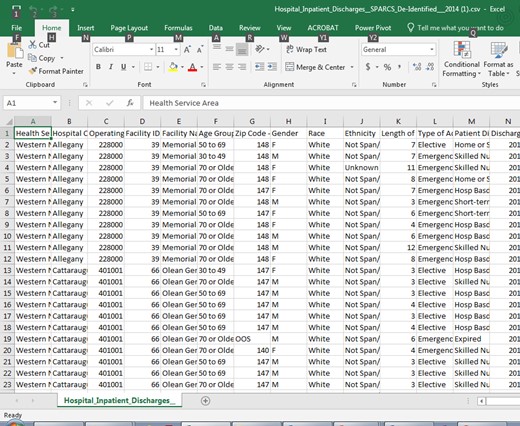
Exploring SPARCS into Excel.
- A Cardinal rule of data management: DO YOUR ANALYSIS USING A COPY! Keep your original dataset in a safe place and do not touch it, ever. In this way, “Save as” SPARCS 2014 Practice Dataset as an “Excel Workbook” and not as “CSV.” This is your original file, not to be touched. Make a new copy for this tutorial called “Tutorial 1.”
- Use “Freeze Panes” and the Filter tool to explore the dataset. Also look at the metadata and answer the following questions
| Question | Your Answer |
| What do these columns mean?
Year |
|
| Why is the ZIP code 3 digits? (And what is “OOS”?) |
|
| Why are there blank values for abortion records or small populations? |
|
| Are there any data elements that do not provide any additional information (same information than other column)? |
|
- Delete columns we don’t need for our analysis in the following tutorials. This step is not critical, but helpful for a large dataset like this (There is a short video tutorial including steps 3, 4 and 5 in this document). DELETE ALL THESE COLUMNS: Operating certificate number, facility ID, ZIP code, discharge year, CCS procedure code, CCS procedure description, APR DRG code, APR DRG description, APR MDC code, APR MDC description, APR severity of illness code, payment typology 2, payment typology 3, attending provider license number, operating provider license number, other provider license number, birth weight, abortion exit indicator, emergency department indicator.
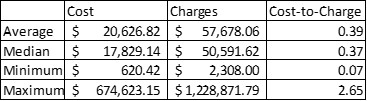
- Create a new variable (Cost-to-Charge Ratio), with the formula Total Costs / Total Charges. With this measure, lower values of the ratio correspond to higher profit margin.
- Create a new worksheet called “Calculations,” and create the following table:
| Question | Your Answer |
| Any surprises? Reactions?
Why is there so much variation?
|
|
Attribution
By Erika Martin and Luis F. Luna-Reyes, and licensed under CC BY-NC-SA 4.0.
