11.3 Weighting Criteria and Sensitivity Analysis
Assigning Weights
The previous section of the chapter introduced basic techniques to normalize the scales associated with each objective or criteria, as well as a simple way of using those normalized scales to assess total utility. In this section of the chapter, we will introduce a useful addition to a MAUT model that will allow you to assign different importance (or weights) to objectives in the model. We will continue using the warming-up example to illustrate the procedure. Weights then represent the values of decision makers that reflect the importance of each goal. Weights assigned to each criteria need to comply with two basic conditions:
- Need to have a value between 0 and 1 (including zero and 1)
- All weighs need to add up to 1
When having only few criteria or objectives, the task of assigning weights can be very simple. Nonetheless, the task can become more complex as the number of criteria increases. We will introduce here a simple and intuitive approach to assign weights that takes advantage of the use of Excel in building a MAUT model. The intuitive process involves 2 steps. In the first step, the decision maker assigns Relative Values to each criteria (see Figure 11.8). We suggest to always use the relative value of 10 to the first criteria, which makes additional assignments easier. We proceed then comparing all additional criteria to the the first one. In the figure, criterium 2 is twice as important as criterium 1 to the decision maker, thus assigning to that criterium the relative value of 20. Objective 3, on the other hand, is half as important compared to objective 1, and thus the decision maker assigned to this objective a value of 5.
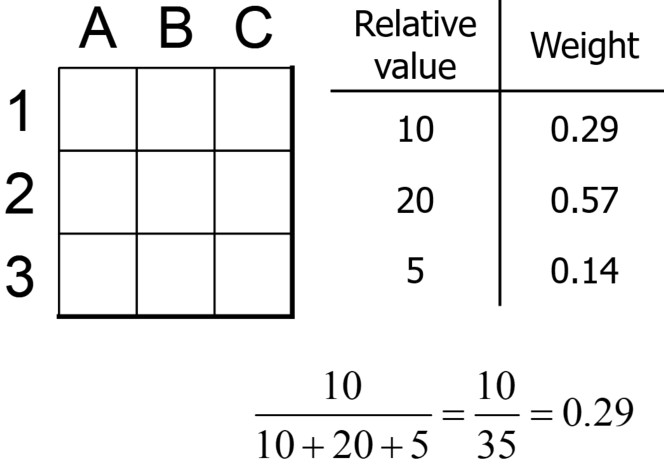
Figure 11.8 Assigning weights to each criteria
Once those relative values have been assigned, calculating the weghts is an easy task using Excel formulas by dividing each relative value by the sum of all relative values.
Calculating Total Utility
Figure 11. 9 and 11.10 include our core model with weights. In order to use the weights to calculate the new utility, we simply calculate the sum of the products of each normalized value and its weight, using the following equation.
[latex]\sum w_i n_i[/latex]
Figure 11.9 show the implementation in Excel of previous equation. depending on the way in which the MAUT model is set-up in Excel, you can also use the =SUMPRODUCT function. Figure 11.10 shows the final model including weighted utilities. It is important to notice that this particular selection of weights changes the model recommendation when comparing to the model that used the same weight assumption, making now Prueba, Inc. the preferred alternative.
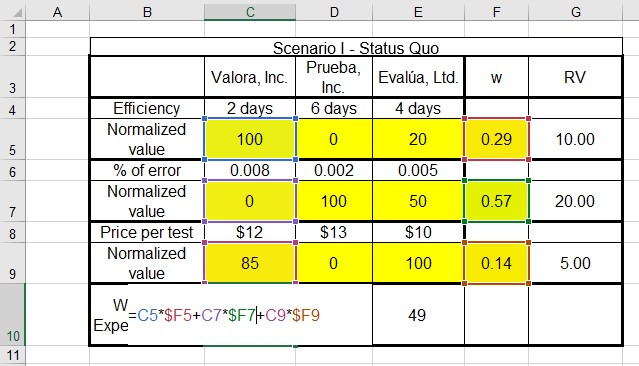
Figure 11.9 Calculating Total Weighted Utility
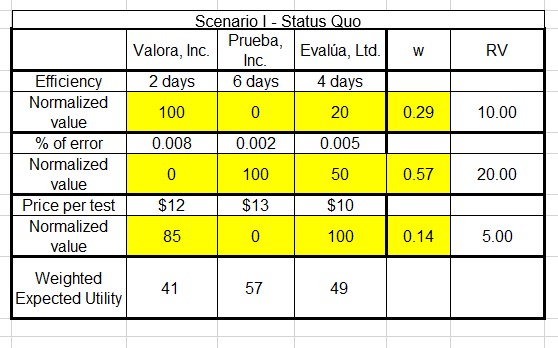
Figure 11.10 Weighted MAUT Model
Sensitivity Analysis
Sensitivity testing is a common tool to better understand how robust is a recommendation from a MAUT model. It involves changing the assumptions of the model to explore changes in the utility values and changes in the model recommendation. Sensitivity testing can be done to both normalized values and weights. Figure 11.10a shows a sensitivity test that changed the relative value of the percentage error reducing it by 20% (from 20 to 16), and Figure 11.10b shows a sensitivity test that increases the normalized value for Evalua efficiency by 50% (from 20 to 30). As it is shown in both figures, utility values change for both tests. Prueba, Inc. continues to be the recommended alternative for both tests. When the recommendation does not change for reasonable adjustments in weights and normallized values, we can say that the model and the recommendation are robust. When the recommendation is sensitive to those tests, the recommendation is then less robust.
Sensitivity analysis is the systematic exploration of the robustness of a model by exploring how sensitive is the model to a series of sensitivity tests.
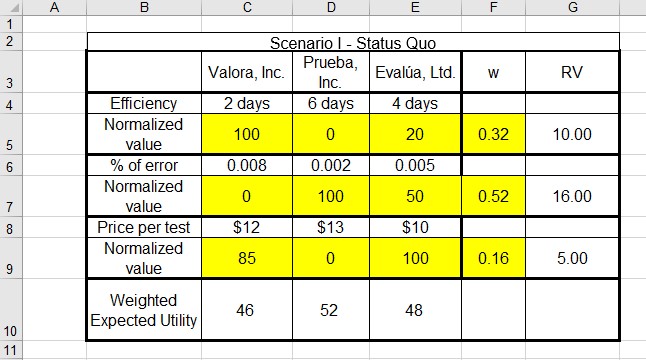
Figure 11.10a Sensitivity test changing weights
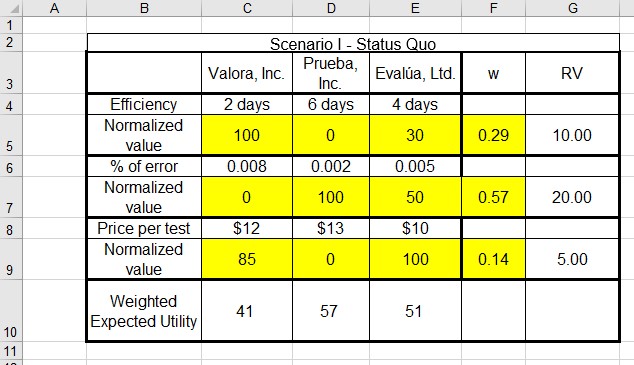
Figure 11.10b Sensitivity test changing normalized values.
Attribution
By Luis F. Luna-Reyes, Erika Martin and Mikhail Ivonchyk, and licensed under CC BY-NC-SA 4.0.
