10.5 Illustration of Comparative Operating Leverage Plans
We can now plot out the entire operating leverage picture.
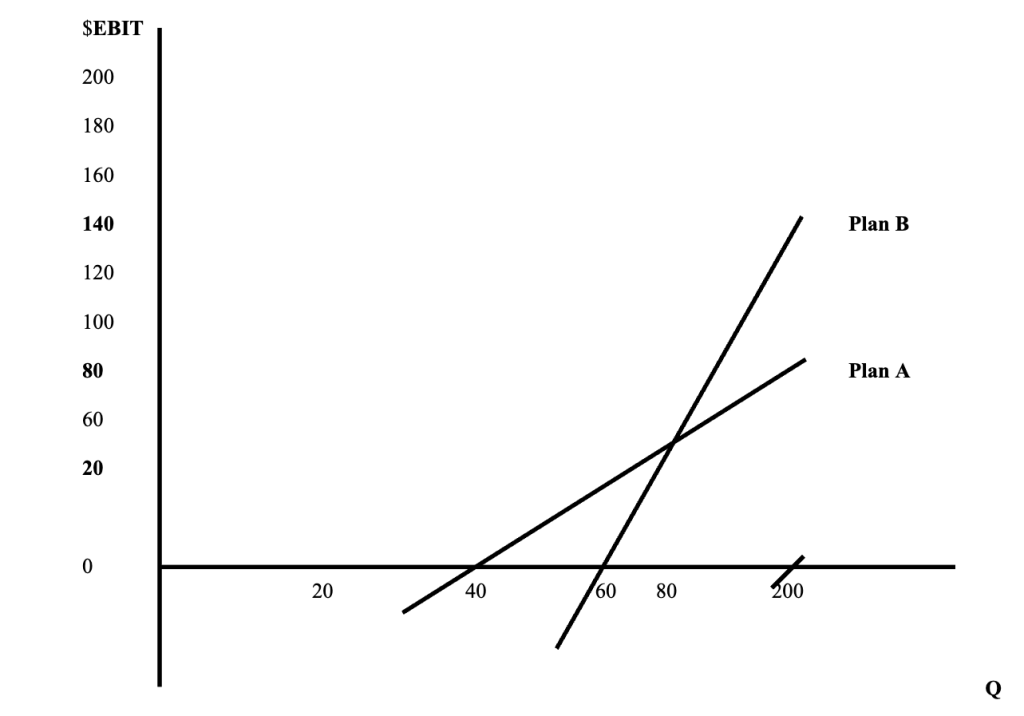
You will notice that Plan B’s line is steeper than A’s. For every unit move in the horizontal axis (Q), there will be more movement in Plan B (EBIT) than in A – both up and down. This means there is more volatility (risk) in Plan B. This is because, once the firm’s Q moves to the right of the crossover point, the fixed costs will be covered, and then EBIT will move more rapidly up and down due to the lower variable cost in Plan B versus Plan A.
In reality, even the fixed costs may not be fixed. There may come a point, at a very high production level, whereby investment in another machine may be required due to “lumpy assets.” At that point, this analysis may be emulated or reiterated, considering, as if from the start, whether it pays to produce the new increment in Q with man (labor) or machine (capital).
