5.3 Financial Leverage (Graph)
Using the data for EBIT, ROE, and EPS on the prior pages, graph below the two cases provided. (You may plot EPS and ROE congruently with one another.) You will observe a “crossover point,” i.e., a point at which both cases produce the same EBIT, on the horizontal axis. Note that when the projected EBIT exceeds the crossover point, the company’s projected EPS and ROE are more favorable if leverage is employed – and vice versa. In the graph below, plot the data from two pages back. The EPS and ROE points will be congruent. (On the vertical axis, we have noted ROE values.) Note that the leveraged plan has a steeper slope.
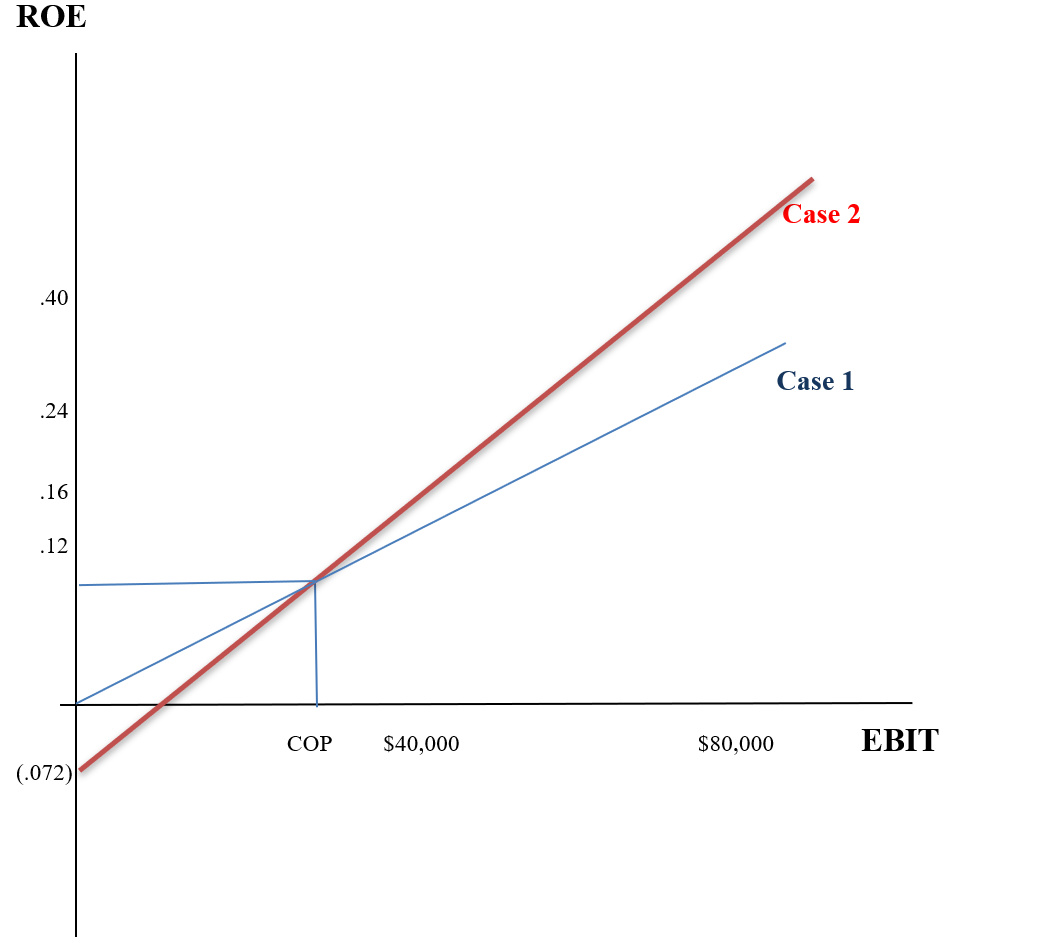
The “crossover point” (“COP”) on the horizontal axis is the point at which the two (or more) alternative plans intersect – as diagrammed above. To the right of this point, increased leverage is advised, as it will provide higher EPS and ROE. (At the crossover point, the ROE and EPS for each alternative respectively, will be the same.) That’s what shareholders want! On the next page, we shall calculate the precise value of the crossover point.
