5.10 Optimal Capital Structure
The “optimal” capital structure is the one that minimizes the weighted average cost of capital, or WACC. Capital Structure refers to the mix of debt and equity. Financial risk refers to the chance that the firm may become insolvent or go bankrupt.
What is the optimal capital structure? If a company has no debt, there would be no financial risk – only business, or operating, risk. (The company may still go bankrupt due to business causes, but not due to “financial” causes.) So, let’s use 100% Equity!
We also know that debt is the cheapest capital component. This fact would argue for using virtually 100% debt in the corporation’s capital structure, except for a minimal amount of equity to be had for the owners.
Once again, we recall that, as debt increases, so too does the risk of insolvency – and bankruptcy. As this risk increases, so too does the cost of debt in the manner of higher interest rates. Thus, the debt ratio should be less than 100% of total assets. There should be some debt because it is cheapest up to a point, but not too much! How much less? “It depends”! In summary, the ideal debt ratio is somewhere between 0-100%!
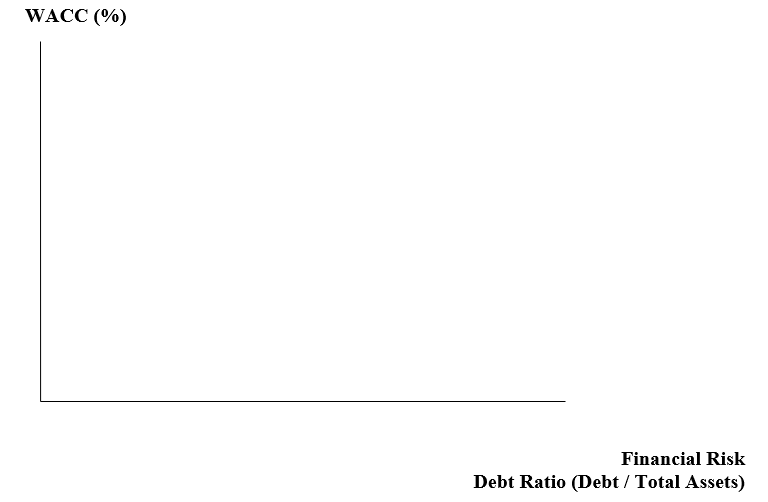
The horizontal axis ranges from 0% to virtually 100% debt as a percent of total assets. If the company has virtually 100% equity, the curve will intersect the vertical axis at some relatively high point on it. Draw in that point – on the axis.
Contrarily, if it had, say, 99.9% debt, it would have a coordinate high vertically and to the extreme right horizontally. As we continually decrease Equity – moving to the right, a decreasing curve emerges, i.e., curving downward to the right in a partial “U” shape. The increased use of debt will lower the WACC – up until a low point, at which point increased debt will subsequently come with a higher interest rate. As debt increases further, lenders perceive greater default risk and demand higher interest rates in order to compensate. The WACC will start rising. The curve too will start rising as it moves further to the right.
Can you draw in this optimization relationship in the graph above? It should appear as a “U,” with the low point (i.e., the “optimization point”) being the “optimal capital structure”; this is the lowest WACC. Another point will touch high up on the vertical axis.
To reiterate, as we increase the amount of debt from zero on the vertical axis to the right, the WACC will be reduced in some manner until it reaches its lowest point. Then, at its low point, as we continue increasing debt, and as the debt ratio increases, the WACC will increase in some proportion to the increase in the debt ratio – due to the increased default and bankruptcy risks, and the consequential rise in lending rates or market yields.
The effective use of leverage, i.e., the carefully measured use of debt, can increase the firm’s ROE above its ROA (see the DuPont Model in your Introduction to Financial Analysis text by this author); with no debt, ROA = ROE. Remember that in the DuPont Model, ROA = NI / TA and ROE = NI / Eq. Net Income is in both the ROA and ROE numerators. Borrowing does not assure in all instances that ROE > ROA. This will occur if EBIT is projected to exceed the crossover point. It will also occur if the increase in EBIT exceeds the increase in Interest Expense.
Again, what is the optimal point, the ideal amount of leverage? We said earlier that “it depends.” Unfortunately, there is no mathematical formula that may be implemented to solve for the low point on the “U”-shaped leverage curve. In fact, the actual, current, or existing capital structure is (not completely seriously) said to be the ideal one – otherwise the corporation’s – rational – managers would not have chosen it! (oh, c’mon; really?) The choice of capital structure, in fact, depends on numerous variables, some of which are qualitative and immeasurable, as noted below.
| Industry Characteristics | Management risk profile |
| Shareholders’ risk profile | Relative capital costs |
These characteristics will be discussed in proceeding sections. First, let us examine the impact of varying capital structures on “shareholder value” – share price. It is not so simple or straightforward. We will then discuss the four characteristics noted immediately above.
