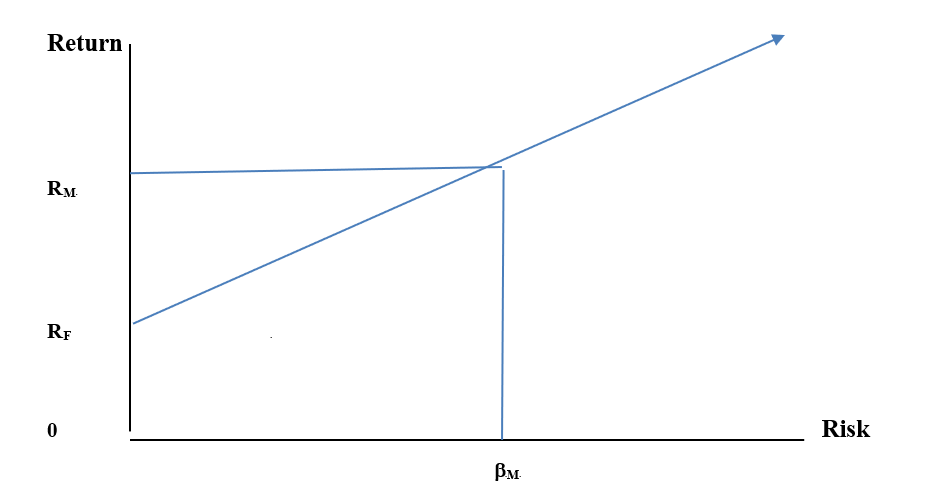
3.13 Diagram of the CAPM
In order to diagram the “CAPM,” let us devise an example. Suppose you are given the following:
RM = .20
RF = .05
βP= 1.5
Then,
RP = RF + (RM – RF) βP
RP = (.05) + (.20 – .05) 1.5 = .275
In this case, you have chosen a stock with greater volatility than the market, and your risk premium will provide a greater return as well. Just beware that risk also means that your expected return is not assured in the short-run and that, in the long-run, things may change so as to alter the formula’s inputs. Life is not so simple.
Now we can graph this (try to fill this in):
See the next page for more insight.
