5.8 EBIT and ROE for Different Degrees of Leverage: A Diagram
The diagram below depicts the relationships between various levels of EBIT and its corelative ROEs given differing degrees of Leverage as calculated in the preceding pages. Take note that all DOLs pass through the same crossover point. If EBIT is forecasted to be significantly higher (to the right) of the crossover point, an aggressive management would choose a high degree of leverage (80/20) for that capital project.
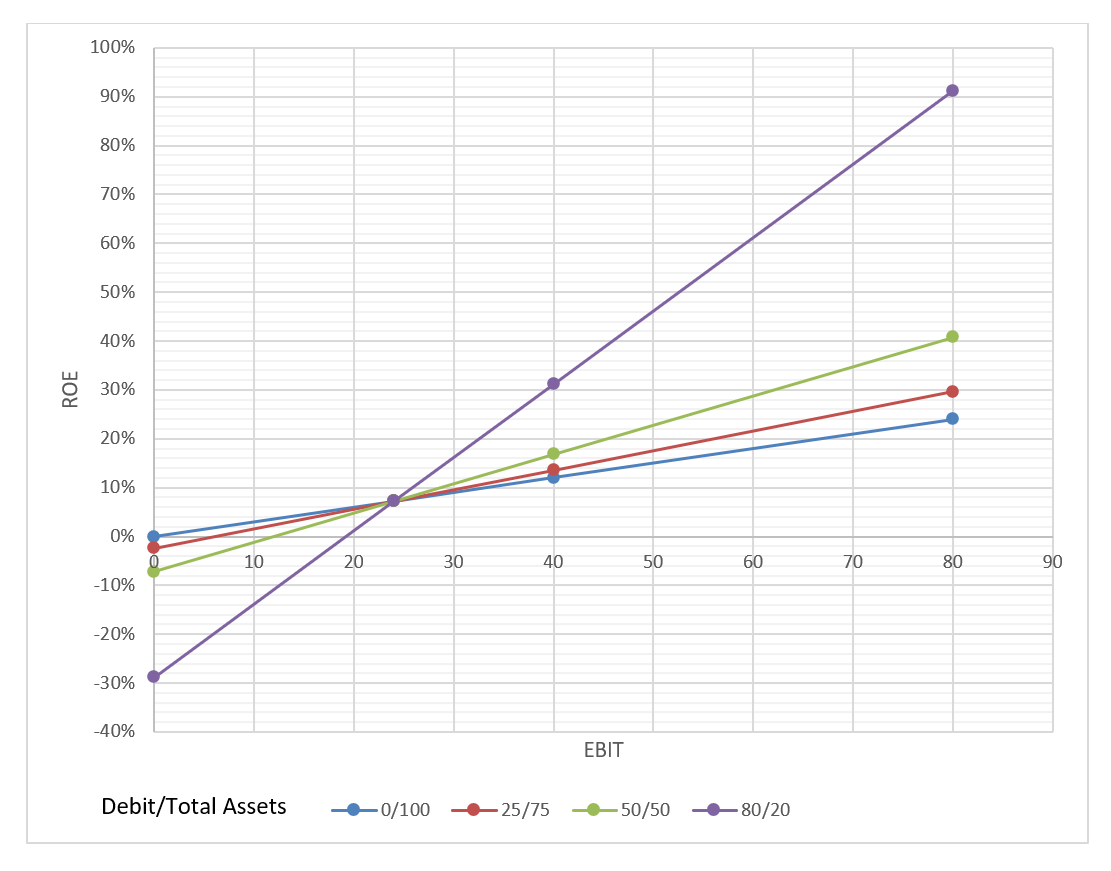
- Many thanks to Shaya Gross and Yitzy Lisker (LCM (’22) for providing this diagram.
