2.4 NPV Profiles Illustrated
On this page, diagram the NPV Profiles for project “A” and “B” at the various discount rates provided above. You will observe that which was discussed above. Take note of the curvature of the lines. The IRR for “Project C” is also the point at which the NPVA = NPVB.
| Accept | Reason | |
| NPV | A | If k < x |
| B | If k> x |
Here, “k” is the discount rate / cost-of-capital, and “x” is the crossover point.
If the projects are mutually exclusive, and the cost of capital exceeds the crossover rate, both NPV and IRR methods will yield the same choice, which is to accept “B” and reject “A” – except when k > 24%, in which case the IRR indicates the rejection of both projects. The completed table is found below (dollars on the vertical; rates on the horizontal).
Comparison of Projects A and B[1]
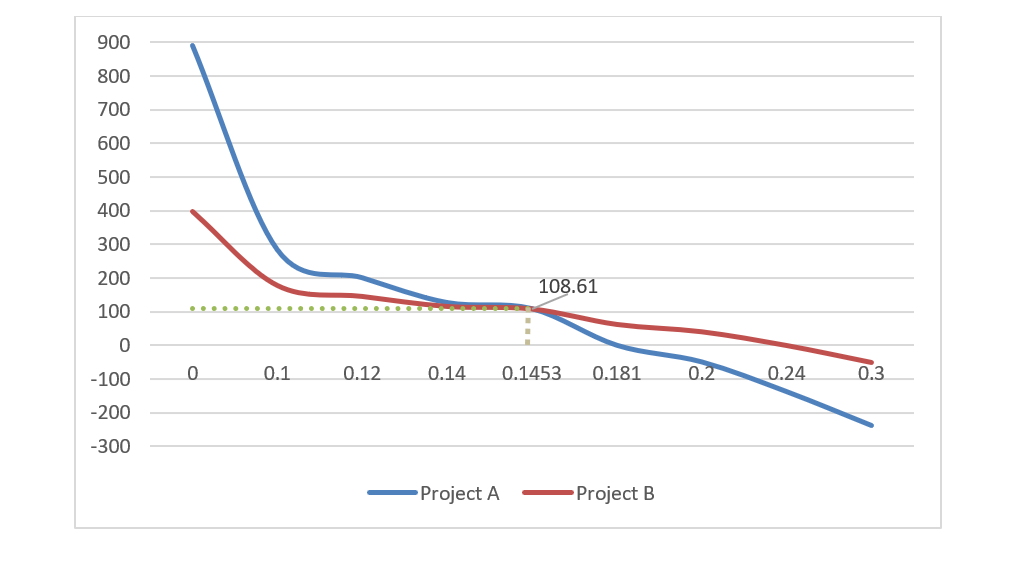
At all discount rates greater than 14.53%, the NPV for “B” shall be higher. At an NPV set to zero, “B” has a higher IRR, i.e., 24% versus 18.1%. If the cost of capital is less than the crossover rate, the two methods will yield conflicting decisions. For example, if the discount rate, or cost of capital, were 10%, we would prefer Project A on an NPV basis, but still prefer B on the basis of the IRR. Check the numbers!
This highlights two problems with the NPV method that has not been mentioned so far: the NPV is sensitive to changes in the discount rate, so much so that in certain cases, a change in the rate, say from 14% to 15%, can yield a change in choice. Also, the project with the steeper curve (Project A) will be more sensitive to changes in discount rates than the other – in terms of its NPV.
- Many thanks to Mr. Yeshaya Gross (Touro College, class of 2022) for creating this diagram. ↵
