3
For this exercise, we will be examining measures of central tendency using SPSS. We will be working with the “DC_Climate.sav” dataset which contains climate data for January in Washington, DC from the National Weather Service Forecast Office, Baltimore/Washington.
First, open the dataset using SPSS. There are four variables listed: year, average temperature, total precipitation, and total snowfall. On the bottom of your screen, you can click on Variable View to view these variables. Then, go back to the Data View tab.
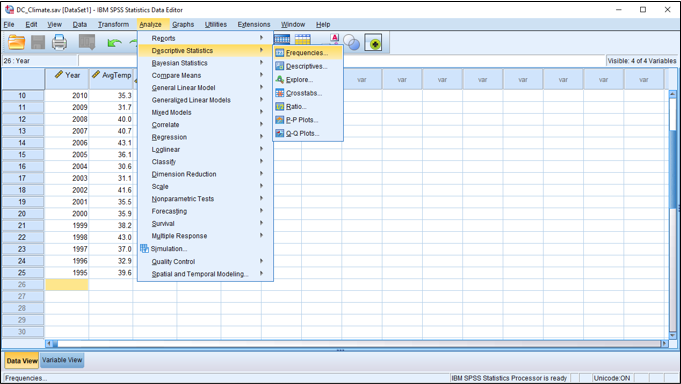
Next, click on Analyze, then Descriptive Statistics, then Frequencies.

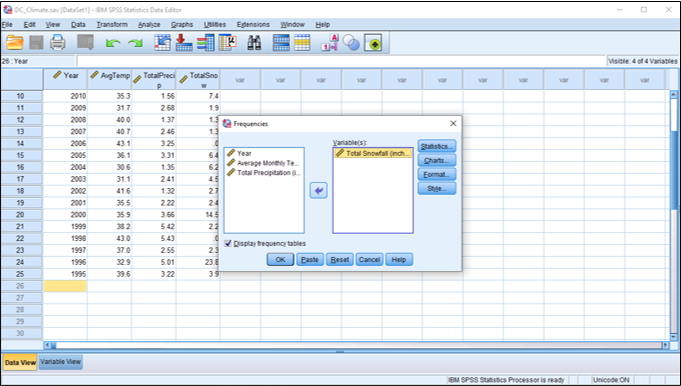
A dialog box should appear. We are interested in what the mean snowfall is in Washington, DC in January. Move “Total Snowfall” to the Variable(s) box, either by double-clicking “Total Snowfall” or by highlighting it and clicking the arrow.

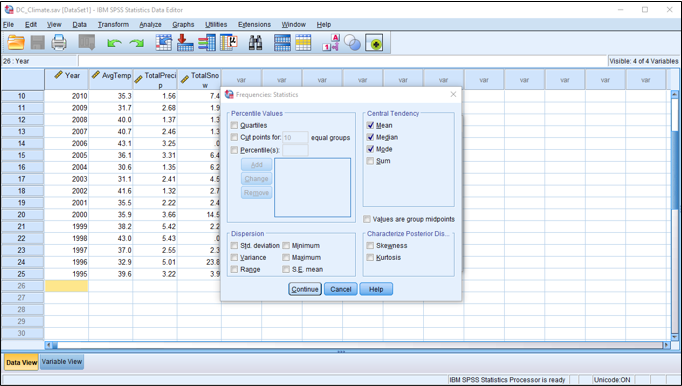
Now we need to select the statistics we’re interested in. Click Statistics and then check “Mean,” “Median,” and “Mode.” Then, click Continue.

Finally, click OK.
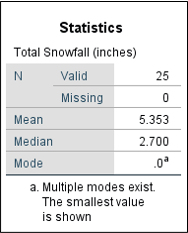
Now, look at your Output window. What is the mean snowfall amount in January in Washington, DC? You should see a value of 5.353 inches.

You should also see that the median snowfall is 2.7 inches. What is the mode? You’ll see a footnote that multiple modes exist. If you look at the frequency table, there were two years where there was zero snowfall and two years with 1.3 inches of snowfall. In some datasets, there might be no mode if no value is repeated.
Now see if you can find the mean average temperature and the median total precipitation in January on your own.
