7
For this exercise, we’ll be measuring variability with Excel using the same “DC_Climate.xlsx” dataset from the previous lab exercise which contains climate data for January in Washington, DC from the National Weather Service Forecast Office, Baltimore/Washington.
First, open the dataset using Excel. There are four variables listed: year, average temperature, total precipitation, and total snowfall.
Previously, we were interested in the mean snowfall in Washington, DC in January, but now we want to know how much that snowfall varies. How much snowfall might we expect in a January with relatively little snow, and how much in a January with lots of snow? Let’s start by finding the standard deviation. In an area to the side of your data or below it, type “StdDev Snow” in a cell. Next to it, type the formula for standard deviation, which is =STDEV.S. This is the standard deviation of a sample. Excel also has a formula for the standard deviation of a population and it is =STDEV.P. Now, type the cells you’re analyzing, so add (D2:D26) to your formula, either by beginning with a parenthesis and highlighting the target data and then typing a closed parenthesis, or typing the formula by hand.
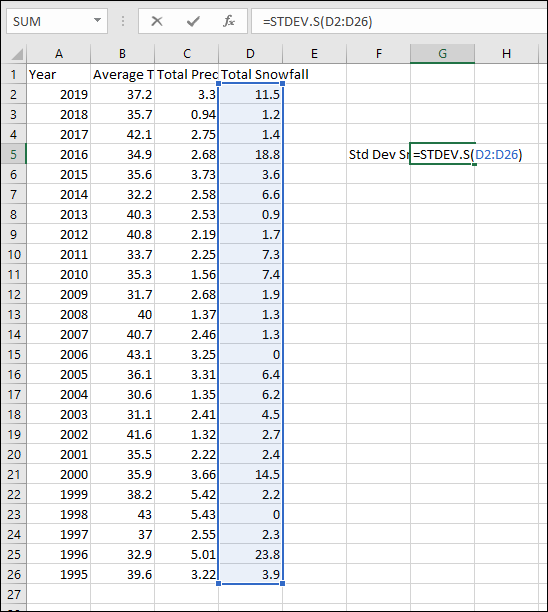
Press the enter key when done. The standard deviation should appear.
You can also calculate the variance using the formula =VAR.S. Note that Excel also has a formula for population variance. Try typing the full formula for sample variance on your own.
Another way to calculate measures of central tendency with Excel is with the Data Analysis toolpak. Click on the Data toolbar and then click the Data Analysis button. In the dialog box that appears, click Descriptive Statistics and then click OK. A new dialog box should appear where you can select your input range (either click the up arrow and select your range or type the range of cells you wish to analyze.) Under “Output options,” select “New Worksheet Ply:” and then click the checkbox next to “Summary statistics.” Finally, click OK.
A new sheet should appear listing a variety of measures of central tendency and variability. Note that sample standard deviation and sample variance are used in this table. This is clear for variance, since it’s labeled as sample, but standard deviation is not labeled as population or sample. You know from your previous calculations that this is the sample standard deviation. You’ll also find the range, minimum, and maximum values.
Try calculating several measures of variability for the average temperature in January on your own.
