15
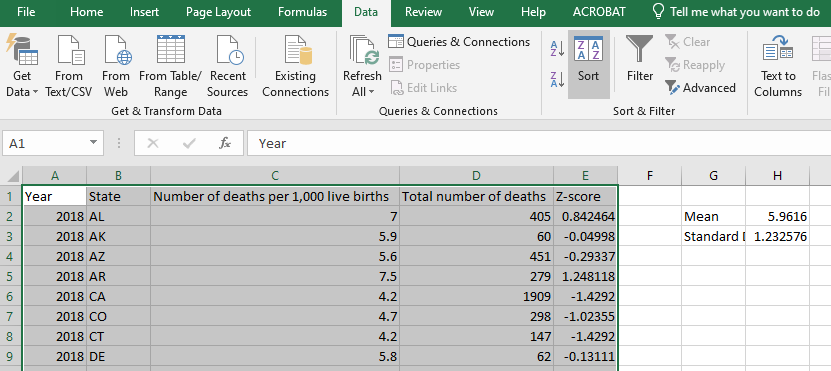
In the previous lab, we calculated the Z-score for the infant mortality rate by state using Excel. Follow the steps in the previous lab, if you have not done so already, to compute the Z-score for each state. You should have five columns of data: the reporting year, the state code, the number of infant deaths per 1,000 live births, the total number of infant deaths, and the Z-score.
Now, let’s use these Z-scores to test for statistical significance. Remember, a Z-score above +1.96 or below -1.96 is statistically significant because there is only a 5% possibility that this score occurred by chance (or put more accurately, we have a 5% chance of concluding that there is a significant difference between the sample mean and the population mean when no actual difference exists.) SPSS does not have a built-in way to test the Z-score, though you can create and run a script to do so. However, if we know the critical Z values we’re looking for, we can determine which scores are significant fairly easily. The best way is to simply sort your data by Z-score and then identify any extreme values.
We can easily sort data using SPSS, but we do need to be careful to select all of our data so that the rows stay together. Highlight all of your data, from cell A1 to E251. Now click on Data on the toolbar and then Sort.
A dialog box should appear. Be sure the check box next to “My data has headers” is checked. Next to Sort by, click the down arrow and select “Z-score” and then be sure the Order is “Smallest to largest.” Then, click OK.

Now, all of your data is sorted by column E going from the lowest Z-score to the highest.
Do any states have a significantly low infant mortality rate? You’ll see that Vermont’s rate in 2016 is less than -1.96, meaning that this value is statistically significant. In other words, if we were testing whether or not Vermont’s infant mortality rate in 2018 differed significantly from the national average during the five-year period of our study, we would reject the null hypothesis and conclude that there is indeed a significant difference.
What about states where infant mortality is considerably higher? Scroll down to the bottom of our list (or to the top if you’ve chosen to sort in a descending order.) You’ll notice that there are six Z-scores that are greater than +1.96. You could conclude that each of these states had a significantly higher infant mortality rate than average. Note also that Mississippi accounts for three of these cases, and you could thus conclude that Mississippi had a significantly higher infant mortality rate than average from 2015-2017. Follow-up research would be beneficial to help determine some possible causes for this higher rate. You might explore rates within Mississippi by county, for example, similarly testing Z-scores to see if any counties have significantly higher rates than average. You could also test to see if there is a significant difference based on race or ethnicity. These tests and further research could then inform public health decisions and initiatives that could work to reduce the infant mortality rate.
