13
In this lab, we’ll learn how to compute correlation coefficients using Excel. We will be using the “World_Bank_Health.xlsx” dataset which contains health data from the World Bank Development Indicators. Countries with missing or incomplete data have been removed from this dataset.
First, open the dataset using SPSS. There are six variables listed: the name of the country, the gross national income per capita in 2018, the incidences of tuberculosis per 100,000 people in 2018, the prevalence of diabetes as a percent of the population ages 20 to 79 in 2019, the health expenditure per capita in 2017, and finally the number of physicians per 1,000 for 2013 to 2018. All of these variables, with the exception of country name, are scale (or interval) data and would be appropriate to use to calculate the Pearson correlation coefficient. There are other types of correlation coefficients, including Spearman and Kendall rank correlation coefficients, that are appropriate for other forms of data such as ordinal (examining the correlation between income and level of education, for example) but this lab will only cover the Pearson correlation coefficient.
Excel uses the CORREL function to find the correlation between two arrays of data. Skip a few rows at the end of your dataset and type a label name, such as “Correlation of GNI and Healthcare.” (Since Excel doesn’t note which statistics you’re using or what data you’re analyzing, it’s best practice to label your statistics in Excel so you can quickly reference them later.) Below or next to this label, choose a cell and type =CORREL and the double-click on the function name that automatically appears. Now we have to select our columns of data. Click cells B2 through B172. Once this column is selected and the cells appear in the formula, type the comma symbol , in the formula. This separates the columns of data. Now, select all of the data in cell E, cells E2 through E172. Finally, add a closed parenthesis symbol at the end of your formula and hit the Enter key.
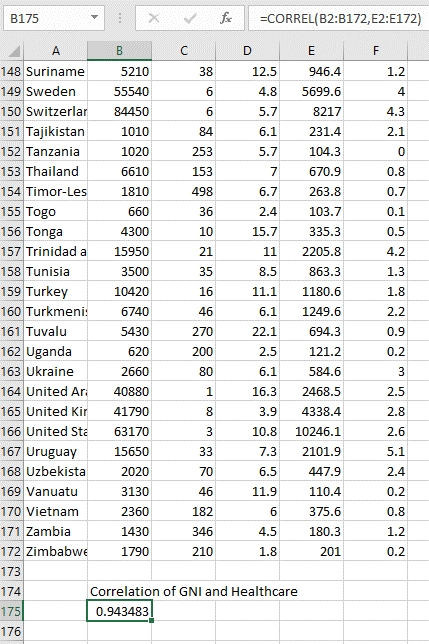
A correlation coefficient should appear in the cell. Nice work!
What is the correlation coefficient for gross national income per capita and the number of physicians per capita? Use the Excel formula and highlight the appropriate columns of data to find the answer.
