6
For this exercise, we’ll be measuring variability with SPSS using the same “DC_Climate.sav” dataset from the previous lab exercise which contains climate data for January in Washington, DC from the National Weather Service Forecast Office, Baltimore/Washington.
First, open the dataset using SPSS. There are four variables listed: year, average temperature, total precipitation, and total snowfall. On the bottom of your screen, you can click on Variable View to view these variables. Then, go back to the Data View tab.
Next, click on Analyze, then Descriptive Statistics, then Frequencies.
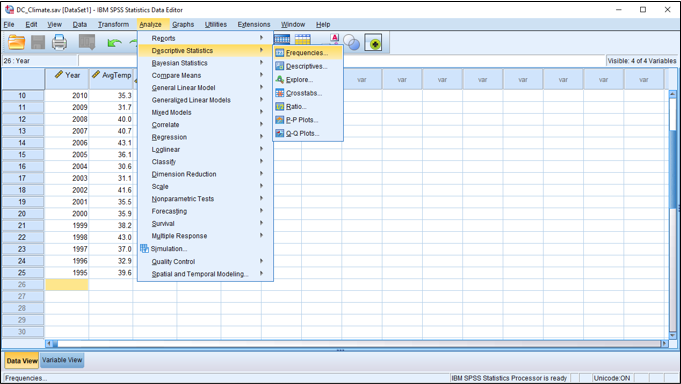
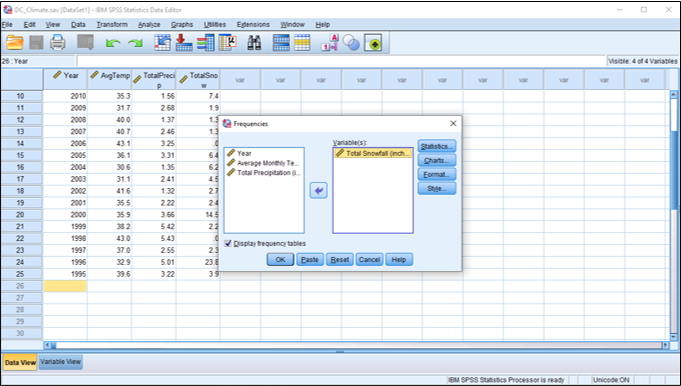
You might remember these same steps from the previous lab exercise on measures of central tendency. A dialog box should appear. Previously, we were interested in the mean snowfall in Washington, DC in January, but now we want to know how much that snowfall varies. How much snowfall might we expect in a January with relatively little snow, and how much in a January with lots of snow? Move “Total Snowfall” to the Variable(s) box, either by double-clicking “Total Snowfall” or by highlighting it and clicking the arrow.
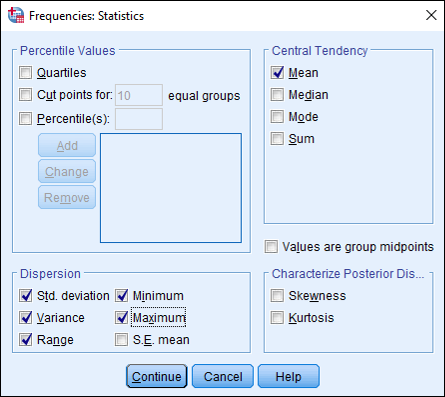
The next step is to select our statistics. Previously, we selected measures of central tendency. Now, notice the box labeled “Dispersion.” In this area, check Std. Deviation, Variance, Range, Minimum, and Maximum. You should also check Mean in the “Central Tendency” section. Then, click Continue.
This will return you to the previous dialog box. You can leave Display frequency tables checked. Finally, click OK in the original dialog box, which tells SPSS to calculate the values you’ve selected for the variable(s) you chose. Now look at the Output Viewer window. You should see two tables, one showing a summary of the statistics you selected and the other, a frequency table of all the snowfall values.
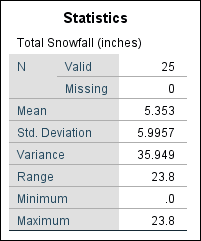
What is the standard deviation of snowfall in January in Washington, DC? You should see a value of 5.9957. What is the minimum? 0. So in some years, there was no snow at all. What is the maximum? 23.8 inches, meaning that in some years, there was quite a lot of snow. You might conclude, just by examining the mean, that average snowfall in January in Washington, DC is about 5 inches, but when examining the measures of variability, you’d find that there’s actually quite a wide range and the average variation, what we call the standard deviation, is 6 inches, which is quite high compared to our mean.
