21
In this lab, we’ll learn how to complete an Analysis of Variance (or ANOVA) with more than one factor, which is known as Factorial ANOVA or two-way ANOVA when there are two independent variables. For this lab, we’ll be working with the “Demographics_Income.sav” dataset which contains some of the data from the 2018 General Social Survey (GSS). The GSS is a project of the independent research organization NORC at the University of Chicago, with principal funding from the National Science Foundation. The dataset we’ll be using is a sampling of data from the GSS representing the first 150 cases that had complete data for each of three selected variables. The actual 2018 GSS dataset is much larger with over 2,300 respondents and more than 1,000 different variables.
First, open the dataset using SPSS. You’ll notice there are three variables in this dataset: race (white, black, or other), gender (woman or man, note there were no transgender respondents in the first 150 cases with complete data), and the respondent’s income. Click on the “Variable View” tab to view the value labels for race and gender.
Back in the “Data View” tab, let’s run a factorial ANOVA to see if there is any relationship between race, gender, and income. Why would this be appropriate for factorial ANOVA? In one-way ANOVA, we have one grouping variable (such as race, gender, region, etc.) and one dependent variable. With factorial ANOVA, we have more than one independent variable that we are using to group our cases. In our example, we have both race and gender.
To conduct a factorial ANOVA using SPSS, click Analyze, then General Linear Model, then Univariate. A “Univariate” dialog box will appear. Our dependent variable is income, because we’re wondering if income is dependent upon (or affected by) gender and/or race. Move “Income” to the “Dependent Variable” box by clicking the variable in the list and then clicking the arrow next to the “Dependent Variable” box. Now, let’s identify our factors. In most cases, you will be working with fixed factors. (Fixed factors simply refer to values that would be the same from one study to the next, such as race, gender, etc. Random factors are those that are selected from a larger possible set of values, such as a sampling of various areas along a stream from a larger set of possible watershed areas.) Move “Race” and “Gender” to the “Fixed Factors” box. Finally, it is often helpful to have descriptive statistics for our independent variables, so click Options…, then click the check box next to “Descriptive statistics” (located at the top right of the dialog box), then click Continue. Finally, click OK.
You should see three tables in your Output Viewer window. One is a table listing the various groups and their sample size, which is helpful when working with large sets of data to insure you haven’t overlooked a particular group or having missing data. The next table is our descriptive statistics, with the mean values for each of our variable pair (such as white woman, white man, etc.) The last table is the results of your ANOVA test. You’ll see the sum of the squared variances as well as the mean square value, which is helpful when conducting or double-checking ANOVA by hand. Each factor, or independent variable, will be listed in a separate row and you can find the F statistic and the significance level in the associated row.
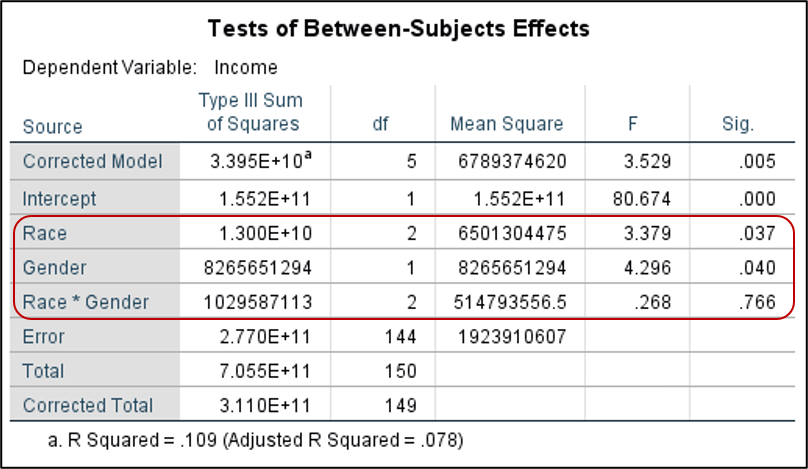
Are there main effects present? Main effects refer to independent variables that have a statistically significant relationship with a dependent variable. In our example, there is a main effect for both race and gender, as both have a p value of less than .05. Is there an interaction effect? Look at the row labeled Race*Gender – this refers to the interaction between race and gender. It is not statistically significant, so there is not a significant interaction between race and gender.
So what conclusions can we make based on this data? There is a significant impact of both gender and race on income, though the particular combination of race and gender was not found to be statistically significant.
