10
In this lab exercise, we’ll learn how SPSS can be used to calculate Z-scores. For this lab, we’ll be using the “Infant_Mortality.sav” dataset, which contains infant mortality data for every state in the United States from 2014 to 2018. Begin by opening the dataset with SPSS.
You’ll notice that this dataset has four variables: the reporting year, two-letter state code, rate of infant deaths per 1,000 live births, and the total number of infant deaths in each state that year. While this is perhaps a grim dataset, differences in infant mortality can tell us a great deal about maternal health and nutrition, access to quality healthcare, and regional or ethnic/racial differences in the level of care mothers and infants receive.
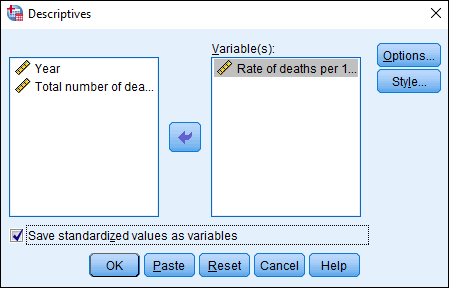
To calculate the Z-scores, click on Analyze, then Descriptive Statistics, and then Descriptives. A “Descriptives” dialog box should appear. Let’s explore how the rate of infant deaths varies by state since this accounts for states with larger populations. Click “Rate of deaths…” and move it over to the “Variable(s)” section either by highlighting it and clicking the arrow or by double-clicking. Be sure to click the checkbox next to “Save standardized values as variables.” Then, click OK.
Now look at your Output Viewer window. You should see a Descriptive Statistics table, but where are the Z-scores? Remember, Z-scores are calculated for each raw score, so they have been added in the data view as an additional column. Go back to the Data Editor Window to see the list of Z-scores.
There should now be a fifth column labeled “ZRate.” Mississippi has often been reported as having one of the highest infant mortality rates in the United States. What is the Z-score for the infant mortality rate in Mississippi in 2018? What are the chances a state would have a higher infant mortality rate than Mississippi in a given year? (Remember, you can find the corresponding probability associated with a particular Z-score either by using a Z-score table, often found in the backs of statistics textbooks, or by using an online calculator.) What is a state that had a relatively low Z-score in 2018, and what is the probability a state would have a higher infant mortality rate than the state you selected?
In the next lab, we’ll use this same dataset to test for statistical significance of the Z-score.
