4
For this exercise, we will be examining measures of central tendency using Excel. We will be working with the “DC_Climate.xlsx” dataset which contains climate data for January in Washington, DC from the National Weather Service Forecast Office, Baltimore/Washington.
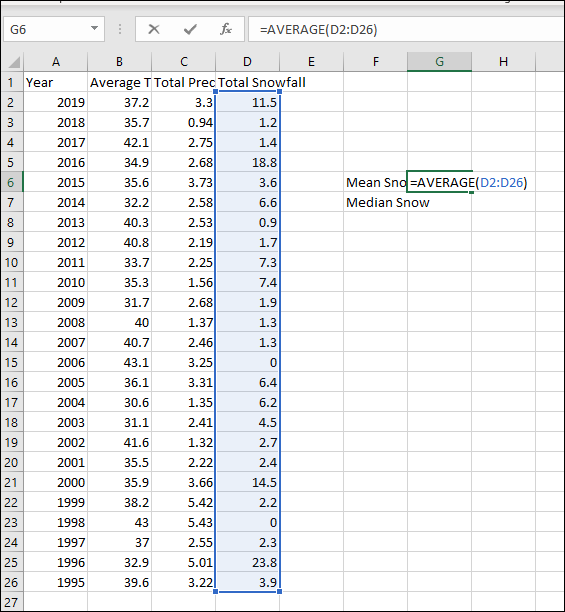
First, open the dataset using Excel. There are four variables listed: year, average temperature, total precipitation, and total snowfall.
Let’s begin by finding the mean snowfall for January in DC over this time period. Somewhere to the side of your data or below it, type “Mean Snow” in a cell. Next to it, type the formula for mean, which is =AVERAGE. With newer versions of Excel, possible formulas will appear as you type and you can click on the formula you’re using. The snowfall data is located in cells D2 through D26, and remember that for Excel formulas, you reference the cells after calling a function. So, the full formula for calculating mean snowfall is =AVERAGE(D2:D26). You can either type this formula as displayed, or once you’ve typed =AVERAGE( you can click and highlight this range of cells and then simply add your closed parenthesis and press ENTER on your keyboard.
The mean snowfall should then appear in the cell where you typed your function. Another quick way to find the mean with newer versions of excel is to simply highlight the range of values and the look on the bottom toolbar – you should see an Average value listed, a Count (how many cells you’ve selected that have data), and the Sum.
Now let’s try to calculate the median snowfall. Below where you typed “Mean Snow,” type “Median Snow.” Next to it, type the formula for median, which is =MEDIAN and then the range of values, which in our case would be (D2:D26). Press ENTER. The median value should appear.
Finally, let’s find the mode. It is important to note that Excel has two mode functions, =MODE.SNGL and =MODE.MULT. You should always use =MODE.MULT since your dataset could have multiple modes and this function lists all of them, whereas =MODE.SNGL just lists the lowest value. So, below where you typed “Median Snow,” type “Mode Snow.” Next to it, type =MODE.MULT(D2:D26) and press ENTER, which will return the mode for our range of data. You should see a notification appear that your formula has returned multiple values so it has split these values into two cells. We have two modes, 0 and 1.3.
Another way to calculate measures of central tendency with Excel is with the Data Analysis toolpak. Click on the Data toolbar and then click the Data Analysis button. In the dialog box that appears, click Descriptive Statistics and then click OK. A new dialog box should appear where you can select your input range (either click the up arrow and select your range or type the range of cells you wish to analyze.) Under “Output options,” select “New Worksheet Ply:” and then click the checkbox next to “Summary statistics.” Finally, click OK.
A new sheet should appear listing your summary statistics, including measures of central tendency and variability. Note that only one mode is listed in this table! While Excel is often great for calculating quick statistics on data, it is not always transparent about how statistics are calculated so use it with caution, particularly for more advanced statistical analysis.
Now see if you can find the mean average temperature and the median total precipitation in January on your own.
