11
In this lab exercise, we’ll be working with Excel to calculate Z-scores. For this lab, we’ll be using the “Infant_Mortality.xlsx” dataset, which contains infant mortality data for every state in the United States from 2014 to 2018. Begin by opening the dataset with Excel.
You’ll notice that this dataset has four variables: the reporting year, two-letter state code, rate of infant deaths per 1,000 live births, and the total number of infant deaths in each state that year. While this is perhaps a grim dataset, differences in infant mortality can tell us a great deal about maternal health and nutrition, access to quality healthcare, and regional or ethnic/racial differences in the level of care mothers and infants receive.
To calculate the Z-scores of the infant mortality rates using Excel, we’ll need to first recall the formula for calculating the Z-score, which is:
We’ll need to compute the mean and standard deviation and then will be able to calculate the Z-score.
First, in cell G2, type: Mean. In cell G3, type: Standard Deviation. It’s always best practice when working with Excel to label your formulas.
Next, in cell H2, type the Excel formula for mean: =AVERAGE(C2:C251)
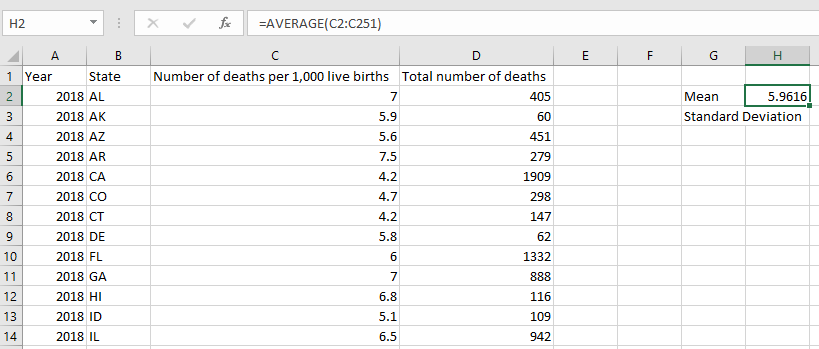
Below that, in cell H3, type the formula for Standard Deviation. Since this is a sample of years, we should use the formula for sample standard deviation: =STDEV.S(C2:C251).
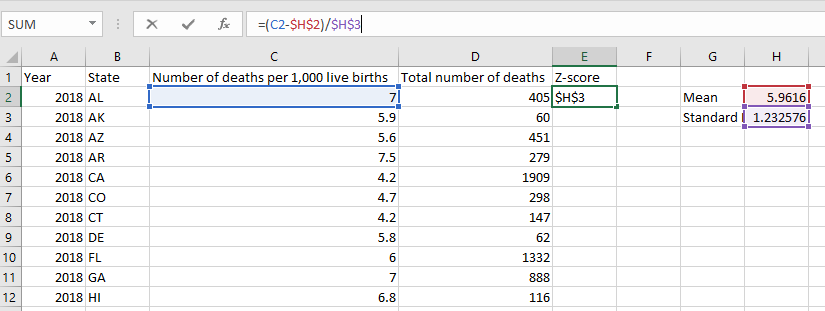
Now we have to compute the Z-score using the formula, which is the the individual data value minus the mean and then divided by the standard deviation. So, at the top of column E1, add a label: Z-score. Then, in cell E2, type: =(C2-H2)/H3.
It would be fastest if we could just copy this same formula for all the cells in our column, but try and copy and paste it into cell E3 and see what happens. You’ll probably get an error, and when you look at the formula, you’ll see it’s changed. As we move down with the cells in column E, Excel is trying to be helpful and move down in cell H as well, but we actually want it to stay still. So, go back to cell E2 and add dollar signs for the references to the Mean and Standard Deviation, which will make Excel stay put on those cells: =(C2-$H$2)/$H$3. Now try copying and pasting again. Hooray! Copy and paste down the entire column of data.
What is the Z-score for the infant mortality rate in Mississippi in 2018? What are the chances a state would have a higher infant mortality rate than Mississippi in a given year? (Remember, you can find the corresponding probability associated with a particular Z-score either by using a Z-score table, often found in the backs of statistics textbooks, or by using an online calculator.) What is a state that had a relatively low Z-score in 2018, and what is the probability a state would have a higher infant mortality rate than the state you selected?
In the next lab, we’ll use this same dataset to test for statistical significance of the Z-score.
