7. Probability
Z-Score
A Z-score, also known as a standard score, is the number of standard deviations a particular raw score is away from the mean. A Z–score of 3, for example, would signify that a particular raw score in a dataset is 3 standard deviations away from the mean.
In the formula, ${X}$ refers to a particular score, $\overline{X}$ refers to the mean for the dataset and ${s}$ refers to the standard deviation. Technically, the formula for Z-score uses the population mean and population standard deviation (which is the symbol $\sigma$), but since these values are generally unknown, the Z-score is calculated using the sample mean and sample standard deviation.
For example, if the mean for a particular dataset is 12 and the standard deviation is 6, what is the Z-score for a raw score of 24? 24 (our X value) – 12 (the mean) = 12. 12/6=2. Thus, the Z-score in this example is 2, meaning the raw score of 24 is 2 standard deviations away from the mean.
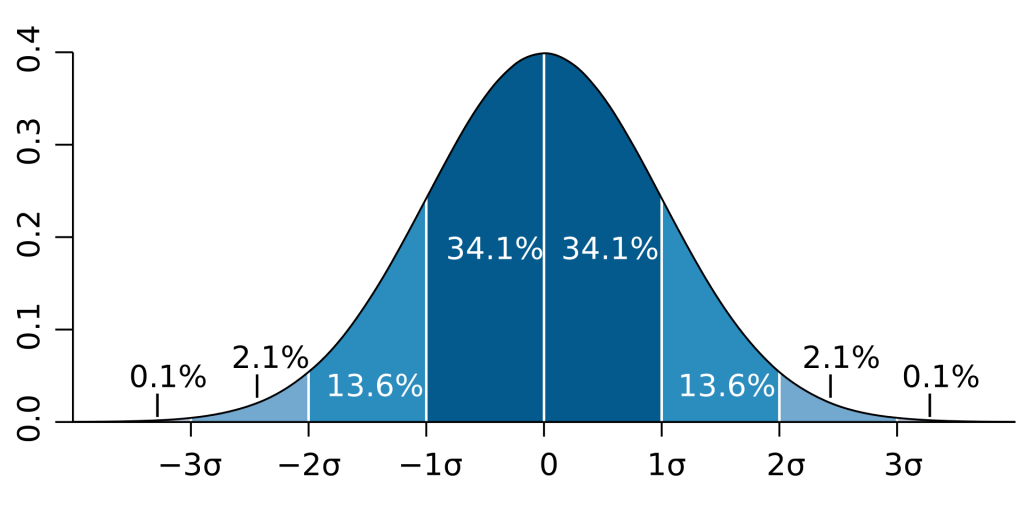
Because the area under a normal curve is standard, Z-scores can also be associated with probability. For example, if a raw score is the same as the mean (a Z-score of 0), then 50% of all values lie above it and 50% of values are below it, right?

A Z-score of 2 would mean that the raw score is greater than 97.7% of all other scores (50% + 34.1% + 13.6%). You can use a Z-score to calculate probability, or the reverse: using the probability to find the associated Z-score. Standard Normal Distribution Tables (also called Normal Tables or Normal Probability Tables) are commonly found at the end of statistics textbooks and calculators can also be found online.
