2
In this lab, we’ll be getting familiar with Excel. You may have used Excel, or a similar spreadsheet program, before but you might not know that Excel can actually calculate a variety of descriptive and inferential statistics.
One word of caution: while Excel can be used to calculate a variety of statistical measures doesn’t necessarily mean it should be used for this purpose. Think of Excel as a spreadsheet program that just happens to be able to do some statistics rather than statistical analysis software. One of the main challenges when working with Excel for more advanced statistics is that it is not always transparent about how statistical measures are calculated. Still, Excel might be appropriate for a quick analysis of data before working with more advanced software.
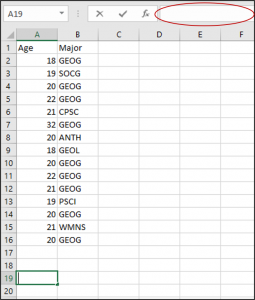
So, let’s open a file and get a quick tour of Excel! Open the file “Statistics_Course.xlsx” using Excel. This is a small dataset consisting of 15 cases and two variables: age and major. With Excel, each column is typically used for a different variable and each row is a particular case (which could be a respondent to a survey, a different country, etc.)
Formulas in Excel are typed in the formula bar above the spreadsheet.

The format for formulas in Excel is the equal sign then the name of the formula and then the range of cells in parenthesis. Let’s try a simple formula now. Say we’d like to find the maximum value in our dataset. We first have to choose our destination cell, where we’d like the result of our formula to appear. Let’s pick cell A19. Click this cell and then either start typing or in the formula bar, type the equal sign = and then MAX. As you type, with newer versions of Excel you should see possible formulas appear. If you click on the desired formula, you’ll see a short description. If you double-click the desired formula, you’ll also see the format of the formula. Now, type an open parenthesis sign ( and then either highlight the cells you’re interested in analyzing or type the range of cells. If you highlight all the age cells, you’ll see your formula automatically updates with the cell range. In this case, A2:A16, which means cells A2 through A16. You could also type these values by hand. Finally, type a closed parenthesis sign ) and then press ENTER on your keyboard. You just typed a formula in Excel. Nice work!
You’ll notice the destination cell now has the result of the formula you typed. It’s best practice to label these cells, particularly when you’re calculating multiple values, so you might type “Max” in cell B19.
One quick tip with Excel is that you can get a lot of information from the lower toolbar. Try highlighting the ages of respondents, cells A2 through A16. Now, look at the bottom tool bar. You should see values listed for Average, Count, and Sum. Pretty handy!
It is also important to know how to use copy and paste to quickly copy formulas and data using Excel. Let’s try an example. Perhaps we also had information about students’ grades in the course. In cell C1, title the column “Grade.” Then, let’s add some random grades for each student, such as 95, 87, etc. Now, let’s find the minimum value in each column. In cell A20, type =MIN(A2:A16) and then press ENTER. Now, click on cell A20 and then right click and click Copy and then right click in cell C20 and click Paste. (You can also hold CTRL + C to copy and CTRL + V to paste, which is what I generally use. This works across all programs, so you can copy hyperlinks, paste images, etc. using these same shortcuts.) Ta da! Your formula automatically copies over, and adjusts itself to reference the cells above it.
Finally, a little-known tool in Excel is the Data Analysis toolpak, which includes a variety of advanced statistical measures. Follow the instructions on the Microsoft website to install it: https://support.microsoft.com/en-us/office/load-the-analysis-toolpak-in-excel-6a63e598-cd6d-42e3-9317-6b40ba1a66b4. It’s free with Excel but doesn’t typically come pre-loaded. Use it with caution, as mentioned, but it could be nice to have on hand or when you don’t have access to more advanced statistical software.
There are lots of other Excel tips and tricks, so play around with the software and check out some guides online!
