Kinematics – Linear Motion
Last Update: 5/10/2024
Position, Displacement, distance
Position
In order to describe the motion of an object, you must first be able to describe its position—where it is at any particular time. More precisely, you need to specify its position relative to a convenient reference frame. Earth is often used as a reference frame, and we often describe the position of an object as it relates to stationary objects in that reference frame. For example, a rocket launch would be described in terms of the position of the rocket with respect to the Earth as a whole, while a professor’s position could be described in terms of where she is in relation to the nearby whiteboard. (See Figure 2.1.) In other cases, we use reference frames that are not stationary but are in motion relative to the Earth. To describe the position of a person in an airplane, for example, we use the airplane, not the Earth, as the reference frame. (See Figure 2.2.)
Displacement
If an object moves relative to a reference frame (for example, if a professor moves to the right relative to a whiteboard or a passenger moves toward the rear of an airplane), then the object’s position changes. This change in position is known as displacement. The word “displacement” implies that an object has moved or has been displaced.
Displacement is the change in position of an object: 

Where Δx is displacement, xf is the final position, and x0 is the initial position.
Note that displacement has a direction as well as a magnitude. The professor’s displacement is 2.0 m to the right, and the airline passenger’s displacement is 4.0 m toward the rear. In one-dimensional motion, direction can be specified with a plus or minus sign. When you begin a problem, you should select which direction is positive (usually that will be to the right or up, but you are free to select positive as being any direction). The professor’s initial position is x0 =1.5m and her final position is xf = 3.5m. Thus, her displacement is


Figure 2.2 – A passenger moves from his seat to the back of the plane. His location relative to the airplane is given by x. The −4.0-m displacement of the passenger relative to the plane is represented by an arrow toward the rear of the plane. Notice that the arrow representing his displacement is twice as long as the arrow representing the displacement of the professor (he moves twice as far) in Figure 2.1. In this coordinate system, motion to the right is positive, whereas motion to the left is negative. Similarly, the airplane passenger’s initial position is x0 =6.0m and his final position is xf=2.0m, so his displacement is


His displacement is negative because his motion is toward the rear of the plane, or in the negative x-direction in our coordinate system.
Distance
Although displacement is described in terms of direction, distance is not. Distance traveled is the total length of the path traveled between two positions. Distance has no direction and, thus, no sign. For example, the distance the professor walks is 2.0 m. The distance the airplane passenger walks is 4.0 m.
Example2.1
A cyclist rides 3 km west and then turns around and rides 2 km east. (a) What is her displacement? (b) What distance does she ride? (c) What is the magnitude of her displacement?

(b) The distance traveled is 3km+2km=5km
(c) The magnitude of the displacement is 1km
A vector is any quantity with both magnitude and direction. Examples of vectors include a displacement of 2.0m due west, a velocity of 90 km/h east and a force of 500 newtons straight down.
The direction of a vector in one-dimensional motion is given simply by a plus, +, or minus, -, sign. Vectors are represented by arrows. An arrow used to represent a vector has a length proportional to the vector’s magnitude (e.g., the larger the magnitude, the longer the length of the vector) and points in the same direction as the vector.
Some physical quantities, like distance, have no direction. A scalar is any quantity that has a magnitude but no direction. For example, a 20° C temperature, the 250 kilocalories of energy in a candy bar, a 90 km/h speed limit, a person’s 1.8 m height, and a distance of 2.0 m are all scalars—quantities with no specified direction. Note, however, that a scalar can be negative, such as a -20°C temperature. In this case, the minus sign indicates a point on a scale rather than a direction. Scalars are never represented by arrows.
time, time interval, velocity, and speed
Time and Time Interval
When we use the word “time“, we mean the reading on the clock. But when we use the term “time interval“, we are referring to the elapsed time. To find the elapsed time, we note the time at the beginning and end of an event and subtract the two. For example, a lecture may start at 11:00 A.M. and end at 11:50 A.M. In this example, 11:00 A.M. is the “time” the lecture started. In other words, the reading on the clock was 11:00 A.M. at the moment the class started. Similarly, 11:50 A.M. is the “time” the class ended. However, the “time interval” for the class or the complete duration of the class was 50 min. Time interval is the difference between the ending time and beginning time. Time is represented with t, and time interval with Δt.

In describing motion, life is simpler if the beginning time, t0, is taken to be zero, as when we use a stopwatch. If we were using a stopwatch, it would simply read zero at the start of the lecture and 50 min at the end. If  Then
Then 
In this text, for simplicity’s sake, motion starts at time equal to zero,
average Velocity and instantaneous velocity
Average velocity is displacement (change in position) divided by the time interval (change in time),

Notice that this definition indicates that velocity is a vector because displacement is a vector. It has both magnitude and direction. The SI unit for velocity is meters per second or m/s. Suppose, for example, an airplane passenger took 5 seconds to move −4 m (the negative sign indicates that displacement is toward the back of the plane). His average velocity would be

The minus sign indicates the average velocity is also toward the rear of the plane.
The average velocity of an object does not tell us anything about what happens to it between the starting point and ending point, however. For example, we cannot tell from average velocity whether the airplane passenger stops momentarily or backs up before he goes to the back of the plane. To get more details, we must consider smaller segments of the trip over smaller time intervals.

Mathematically, finding instantaneous velocity, v, at a precise instant, t, can involve taking a limit, a calculus operation beyond the scope of this text. However, under many circumstances, we can find precise values for instantaneous velocity without calculus. In this book, when we use the term “velocity”, we mean instantaneous velocity.
average speed and instantaneous speed
In everyday language, most people use the terms “speed” and “velocity” interchangeably. In physics, however, they do not have the same meaning, and they are distinct concepts. Speed does not have direction. Therefore, speed is a scalar quantity.
Instantaneous speed is the magnitude of instantaneous velocity. For example, suppose the airplane passenger at one instant had an instantaneous velocity of −3.0 m/s (the minus indicates direction and means toward the rear of the plane). At that same time, his instantaneous speed was 3.0 m/s. Or suppose that at one time during a shopping trip your instantaneous velocity is 40 km/h due north. Your instantaneous speed at that instant would be 40 km/h—the same magnitude but without a direction. Average speed, however, is very different from the average velocity. Average speed is the distance traveled divided by elapsed time.
We have noted that the distance traveled can be greater than the magnitude of displacement. So average speed can be greater than average velocity, which is displacement divided by time interval. For example, if you drive to a store and return home in half an hour and your car’s odometer shows the total distance traveled was 6 km, then your average speed was 12 km/h. Your average velocity, however, was zero because your displacement for the round trip is zero. (Displacement is a change in position and, thus, is zero for a round trip.) Thus, the average speed is not simply the magnitude of average velocity.

Video Example – The difference between the average velocity and the average speed
representations of motion with constant velocity
Equation of Motion
First, let us make some simplifications in notation. Taking the initial time to be zero, as if time is measured with a stopwatch, is a great simplification. Since elapsed time is Δt=tf-t0, taking t0=0 means that Δt=tf, the final time on the stopwatch. When the initial time is taken to be zero, we use the subscript 0 to denote initial values of position and velocity. That is,
x0 is the initial position
v0 is the initial velocity
We put no subscripts on the final values. That is,
t is the final time
x is the final position
v is the final velocity
therefore
Δt=t
Δx=x-x0
Δv=v-v0
To summarize, using the simplified notation, with the initial time taken to be zero, where the subscript 0 denotes an initial value and the absence of a subscript denotes a final value in whatever motion is under consideration.
To get the equation of motion with constant velocity, we start with the definition of average velocity:

Substituting the simplified notation for Δx and Δt yields

Solving for x yields  . In the case where the velocity is constant, there is no difference between the average velocity and the instantaneous velocity. As a result, we get the following equation of motion:
 Motion with constant velocity along a straight line
Notice that velocity could be positive or negative. The sign of velocity represents the direction of motion.
Example 2.2
A jogger runs down a straight stretch of road with a velocity of 4.00 m/s for 2.00 min. What is his final position, taking his initial position to be zero?
Strategy:

To find x, we identify the values of x0, v, and t from the statement of the problem and substitute them into the equation.
Solution


Graphs
The equation of motion for an object moving with constant velocity along a straight line, is a linear equation. This equation is in the same form as y=mx+b.

Therefore, for linear motion with constant velocity, the graph of position vs time (x vs t) is a straight line, and the slope of the line represents the velocity. When the straight line has a positive slope it means that the velocity is positive, which in turn means the object is moving in the positive direction. When the slope of the straight line is negative, the velocity is negative meaning that the object is moving in the negative direction. In a graph of position vs time, the position is plotted along the vertical axis. The point where the straight line crosses the position axis is the position of the object at t=0, or the initial position of the object, x0.
Figure 2.7 shows a graph of position versus time for a jet-powered car on a very flat dry lake bed in Nevada

Notice that this graph starts and ends while the car was in motion. In other words, the car was already moving with a constant velocity at the beginning of the graph and it did not start from rest at t=0. Similarly, it did not stop at t=8s.
From the figure, we can see that the car has a position of 525 m at 0.50 s and 2000 m at 6.40s. Its position at other times can be read from the graph. This results in a slope of

The graph of velocity vs time for this motion is shown below.

Example 2.3
Find the average velocity of the car whose position is graphed in Figure 2.7.
Solution
The slope of the graph of x vs t is average velocity, since slope equals rise over run. In this case, rise = change in position and run = change in time, so that


yielding

Discussion
This is an impressively large land speed (900 km/h, or about 560 mi/h): much greater than the typical highway speed limit of 60 mi/h (27 m/s or 96 km/h), but considerably shy of the record of 343 m/s (1234 km/h or 766 mi/h) set in 1997.
Example 2.4
Jill sets out from her home to deliver flyers for her yard sale, traveling due east along her street lined with houses. At 0.5 km and 9 minutes later, she runs out of flyers and has to retrace her steps back to her house to get more. This takes an additional 9 minutes. After picking up more flyers, she sets out again on the same path, continuing where she left off, and ends up 1.0 km from her house. This third leg of her trip takes 15 minutes. At this point she turns back toward her house, heading west. After 1.75 km and 25 minutes, she stops to rest.
- What is Jill’s total displacement to the point where she stops to rest?
- What is the magnitude of the final displacement?
- What is the average velocity during her entire trip?
- What is the total distance traveled?
- Make a graph of position versus time.
A sketch of Jill’s movements is shown below.

Solution
The problem contains data on the various legs of Jill’s trip, so it would be useful to make a table of the physical quantities. We are given position and time in the wording of the problem so we can calculate the displacements and the elapsed time. We take east to be the positive direction. From this information, we can find the total displacement and average velocity. Jill’s home is the starting point x0. The following table gives Jill’s time and position in the first two columns, and the displacements are calculated in the third column.
| Time ti (min) | Position xi (km) | Displacement Δxi (km) |
| t0 = 0 | x0 = 0 | Δx0 = 0 |
| t1 = 9 | x1 = 0.5 | Δx1 = x1 -x0 =0.5 |
| t2 = 18 | x2 = 0 | Δx2 = x2 -x1 =-0.5 |
| t3 = 33 | x3 =1. 0 | Δx3= x3 -x2 =1.0 |
| t4 = 58 | x4 = -0.75 | Δx4= x4-x3 =-1.75 |
a) From the above table, the total displacement, Δx, is

b) The magnitude of the total displacement is 0.75km.
c) Average velocity is


d) The total distance, d, traveled is the length of the path and it is equal to

e) We can graph Jill’s position versus time as a useful aid to see the motion.

Attributions
This chapter contains material taken from “Openstax College Physics-Introduction to One Dimensional Kinematics” by Openstax and is used under a CC BY 4.0 license. Download this book for free at Openstax-College Physics
To see what was changed, refer to the List of Changes.
Example 2.4 is taken from Openstax University Physics Volume 1 and is used under a CC BY 4.0 license. Access this book for free at https://openstax.org/books/university-physics-volume-1/pages/1-introduction
questions and Problems
Questions
- [Openstax-College Physics (modified)] Does a car’s odometer measure position, displacement, or distance? Does its speedometer measure speed or velocity?
- [Openstax-College Physics (modified)] If you divide the odometer reading by the time for the trip, are you calculating the average speed, the magnitude of the average velocity, or the velocity? Is it possible for any two of these quantities to be the same? Explain.
Problems
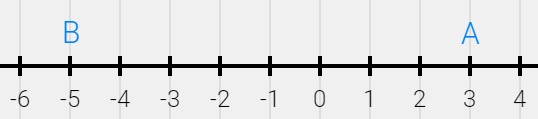
- The scale in the number line below is in meters. An object starts at point B and moves to point A in 4.0s. Stops at point A for 3.0s, and then it moves from point A to point C in 10s.

-
- What is the position of the object at point B? at point A? at point C?
- What is the displacement from B to A? From A to C? What is the displacement for the entire trip from B to A to C?
- What is the distance from B to A? From A to C? What is the total distance traveled in the entire trip from B to A to C?
- What is the average speed from B to A? What is the average speed for the entire trip from B to A to C?
- What is the average velocity from B to A? From A to C? What is the average velocity for the entire trip from B to C
-
- [openstax college phys 2.5]Consider the motion of the Earth around the sun. You may need to look up the distance between the Earth and the Sun to answer the following questions.
- Calculate Earth’s average speed as it revolves around the sun.
- What is the Earth’s average velocity over a period of one year?
- [openstax college phys 2.9]On May 26, 1934, a streamlined, stainless steel diesel train called the Zephyr set the world’s nonstop long-distance speed record for trains. Its run from Denver to Chicago took 13 hours, 4 minutes, 58 seconds, and was witnessed by more than a million people along the route. The total distance traveled was 1633.8 km. What was its average speed in km/h and m/s?
- [openstax college phys 2.11-modified]A student drove to the university from her home and noted that the odometer reading of her car increased by 12.0 km. The trip took 18.0 min.
- What was her average speed in m/s?
- If she returned home by the same path 7 h 30 min after she left her home, what were her average speed and average velocity for the entire trip in m/s?
- [openstax univ. phys. vol.1-3.27 (modified)] The position of a particle moving along the x-axis is given by
 in meters.
- Plot the graph of position vs time and velocity vs time for this particle.
- At what time does the particle cross the origin?
- What is the displacement of the particle between t=3.0s and t=6.0s?
- [openstax univ. phys. vol.1-3.28]A cyclist rides 8.0 km east for 20 minutes, then he turns and heads west traveling 3.0 km in 8 minutes. Finally, he rides east for 16 km, which takes 40 minutes.
- What is the final displacement of the cyclist?
- What is his average velocity?
- [openstax univ. phys. vol.1-3.30] A woodchuck runs 20 m to the right in 5 s, then turns and runs 10 m to the left in 3 s.
- What is the average velocity of the woodchuck?
- What is its average speed?
- The scale in the number line below is in meters.
An object starts at point A and travels to point B with constant velocity in 2.0 seconds.- Write the equation of motion (position as a function of time) for this object. Hint: When velocity is constant, the position as a function of time is in the form of x=vt+x0, where v and x0 are constants. In this problem, you need to find v and x0 and put it all together to write the equation that gives the position as a function of time.
- On its way from A to B, how long does it take for the object to reach the origin, x=0?
- What is the position of the object at t=0.75s?
- Plot the graph of position vs time for this object.
- Plot the graph of velocity vs time for this object.
- Repeat problem 8 but this time assume the object starts at point B and travels to point A with constant velocity in 2.0 seconds.
- [openstax univ. phys. vol.1-3.31 (modified)]The graph of position vs time for an object moving along a straight line is given below.
- For each time interval where the graph is a straight line, indicate whether the object is moving in the positive, in the negative direction, or remaining at rest.
- Calculate the velocity in each time interval and sketch the velocity-versus-time graph for this object.
- What is the average velocity for the entire motion?
- What is the average speed for the entire motion?
- Write the equation of motion (position as a function of time) for the time interval between 0s and 0.4s, and also for the time interval between 0.4s and 0.6s.
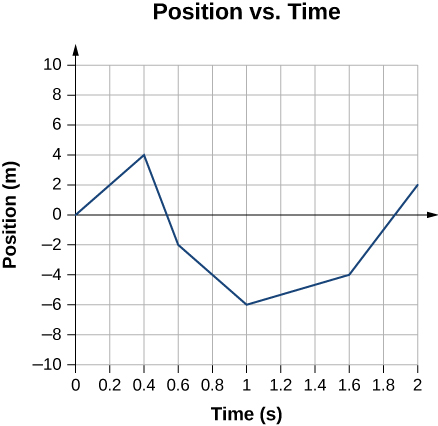
fig-prob2.10 [Image Description]
- [B. Crowell & B. Shotwell] On a 20km bike ride, you ride the first 10km at an average speed of 8.0km/h. What average speed must you have over the next 10km if your average speed for the whole ride is to be 12km/h?
- you run 500m with a speed of 6.0mi/h, then walk 400m with a speed of 3.0mi/h. What is your overall average speed in mi/h?
- [Julio Gea-Banacloche-Univ. Physics I] You leave your house on your bicycle to go visit a friend. At your normal speed of 9 mph, you know it takes you 6 minutes to get there. This time, though, when you have traveled half the distance you realize you forgot a book at home that you were going to return to your friend, so you turn around and pedal at twice your normal speed, get back home, grab the book, and start off again for your friend’s house at 18 mph (imagine you are really fit to pull this off!)
- How far away from you does your friend live?
- What is the total distance you travel on this trip?
- How long did the whole trip take?
- Draw a position versus time and a velocity versus time graph for the whole trip. Use SI units for both graphs. Neglect the time it takes you to stop and turn around, also the time it takes you to run into your house and grab the book (in other words, assume those changes in your direction of motion happen instantly
- [Julio Gea-Banacloche-Univ. Physics I] The figure is the position (in meters) versus time (in seconds) graph of an object in motion. Only the segments between t =1s and t =2s, and between t =4s and t =5s, are straight lines. The peak of the curve is at t =3s, x =4m. Answer the following questions, and provide a brief justification for your answer in every case.
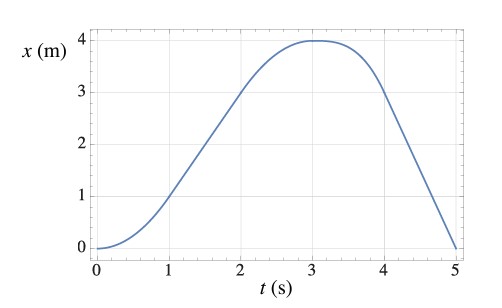
fig-prob2.14 [Image Description] - At what time(s) is the object’s velocity equal to zero?
- For what range(s) of times is the object moving with constant velocity?
- What is the object’s position at t =1s?
- What is the displacement of the object between t =1s and t =4s?
- What is the distance traveled between t =1s and t =4s?
- What is the instantaneous velocity of the object at t =1.5s?
- What is its average velocity between t =1s and t =3s?
- [Light and Matter 2.4-Benjamin Crowell] Alight-year is a unit of distance used in astronomy and is defined as the distance light travels in one year. The speed of light is 3.0×10⁸ m/s. Find how many meters there are in one light-year, expressing your answer in scientific notation.
- [Openstax-college phys 2.14] A football quarterback runs 15.0 m straight down the playing field in 2.50 s. He is then hit and pushed 3.00 m straight backward in 1.75s. He breaks the tackle and runs straight forward another 21.0 m in 5.20 s.
- Calculate his average velocity for each of the three intervals
- Calculate his average velocity for the entire motion.
- [Openstax-college phys 2.66(modified)] The figure shows the position graph for a particle for 6 s.
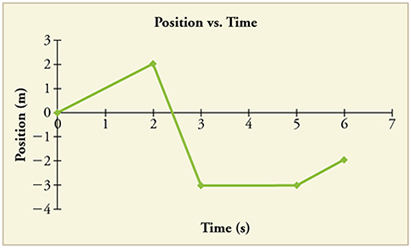
fig-prob2.17 [Image Description] -
-
- Draw the corresponding Velocity vs. Time graph.
- Write the equation of motion (position as a function of time) for the first 2 seconds.
- Write the equation of motion (position as a function of time) for the motion from 2s to 3s.
- Write the equation of motion (position as a function of time) for the motion from 3s to 5s.
- Write the equation of motion (position as a function of time) for the motion from 5s to 6s.
Hint: The equation of motion for an object moving with constant velocity is in the form of x=vt+x0. In this equation t0=0. t0 is the time at which the position is x0.
-
-
- The equation of motion for an object moving along a straight line is x=(-4m/s)t + 20m.
- Sketch the graph of position vs time. Mark the coordinates of the points where the position is zero, and where the time is zero.
- Sketch the graph of velocity vs time. Indicate the scale along the vertical velocity axis.
- Determine the displacement of the object in the time interval between 2

Image Descriptions
fig-prob2.10 image description -This image shows a graph of position vs time that consists of five jagged lines. The vertical position axis is from -10m to +10m, and the horizontal time axis is from 0 to 2s. The first straight line is from (0s, 0m) to (0.4s, 4m). The next one is from (0.4s, 4m) to (0.6s, -2m). The next one is from (0.6s, -2m) to (1s, -6m). The next one is from (1s, -6m) to (1.6s, -4m). The last one is from (1.6s, -4m) to (2s, 2m). [Return to the image]
fig-prob2.14 image description – This image shows a graph of position vs time that resembles a parabola opening down. The vertical position axis is from 0 to 4m, and the horizontal time axis is from 0 to 5s. The curve gradually rises from x = 0 at t = 0, the peak of the curve is at t=3s, x=4m, and then it declines back to x=0 at t=5s. The segments between t =1s and t =2s, and between t =4s and t =5s, are straight lines. [Return to the image]
fig-prob2.17 image description – This image shows a graph of position vs time that consists of four jagged lines. The vertical position axis is from -4m to +3m, and the horizontal time axis is from 0 to 7s. The first straight line is from (0s, 0m) to (2s, 2m). The next one is from (2s, 2m) to (3s, -3m). The next one is from (3s, -3m) to (5s, -3m). The last one is from (5s, -3m) to (6s, -2m). [Return to the image]
