13.7 The Yield Curve
![]() Key Terms:
Key Terms:
Yield Curve
Yield-to-Maturity
Term-to-Maturity
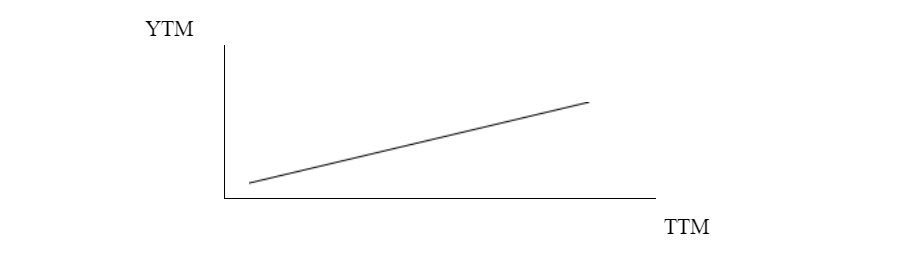
The Yield Curve depicts the relationship between Yield-to-Maturity (YTM) and Term (or Time)-to-Maturity (TTM) for a given class of bond, such as Treasury Notes and Bonds, Municipal Bonds, or Corporate Bonds. When one speaks of the Yield Curve without specifying the instrument, it is assumed to refer to the market for Treasury securities. The yield usually is stated in nominal terms, i.e., not in real terms, which would adjust for inflation. The horizontal axis is the term, or Time-to-Maturity (TTM), and the vertical is Yield-to-Maturity (YTM) or market yield. The slope of the yield curve can be flat, positive (upward sloping) or negative. It may, at times, be kinked. As will be shown later, YTM will determine the dollar-price for a given bond.
![]()
Liquidity Preference
Under “normal” circumstances, the yield curve will reflect an upward, but not necessarily linear, slope; that is, as maturities get longer, yields will also rise. The theory of Liquidity Preference attempts to explain this. Investors prefer being liquid rather than illiquid. When liquid, investors have the entire range of options available to them; they may either spend or invest their money. When illiquid, choices and alternatives are reduced or eliminated. The longer one ties up his money, the greater his illiquidity. As one’s illiquidity increases, s/he will accordingly demand more and more return as compensation for the illiquidity, hence a positively sloped yield curve.
![]()
Inverted Yield Curve
The Yield Curve need not always be positively sloped, however. For instance, in times of tight Federal Reserve monetary activities, short-term rates will be driven up. As markets have learned to interpret tight money policy as effective inflation-reducing medicine, which takes effect over future periods, the longer end of the yield curve tends to decline, leading to a negatively sloped, or “inverted,” yield curve. As Fed tightening usually does not last long (the 2004-2007 period being an obvious exception to this), inversions are similarly short-lived.
The Yield Curve normally is positively sloped due to Liquidity Preference – although it does not have to be a straight line.
Below, we observe average yields for three-month to ten-year government (Treasury) bonds for the decades noted. Yields are first stated in nominal (unadjusted) terms, followed by real (adjusted for inflation) terms. In general, the yield curve is stated in nominal terms, because that is how bond yields are quoted in the market.
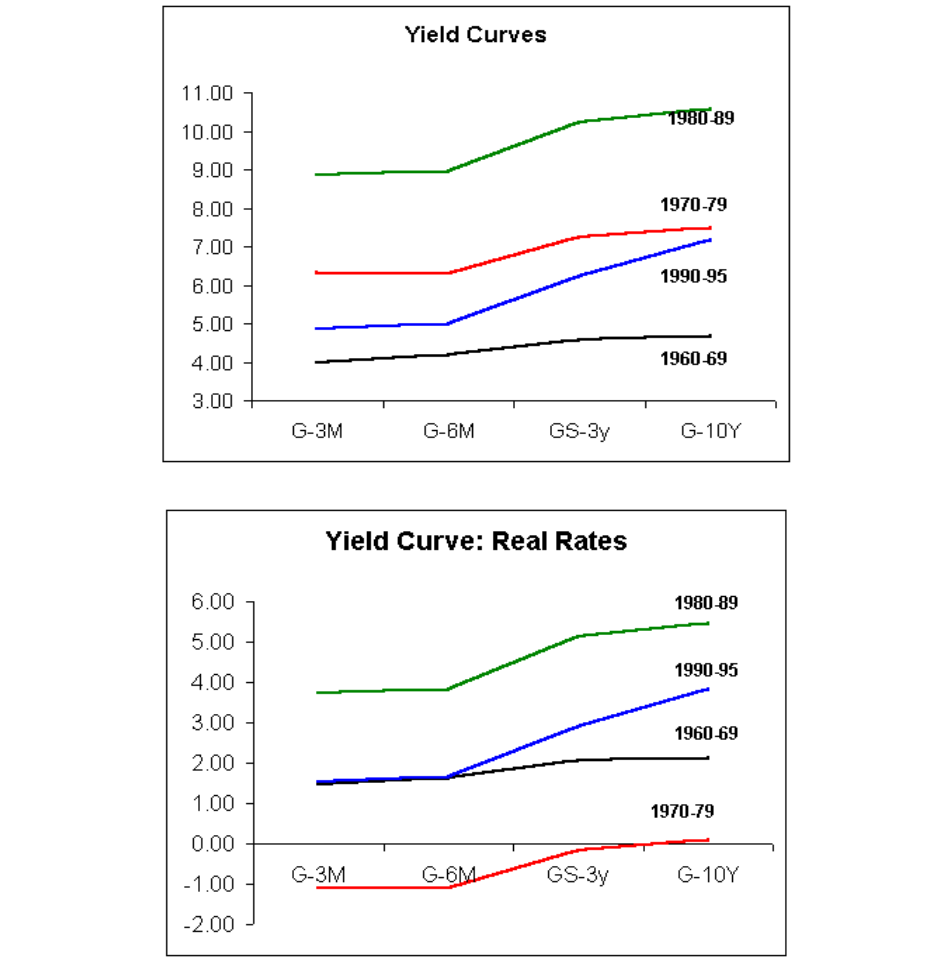
Note:
The yield curve, typically, is presented in nominal terms.
The following link provides some insight into the “historical yield curve,” which is to say, how the yield curve has changed over the last few decades.
