5.8 Solvency Ratios
Solvency has to do with the firm’s ongoing ability to generate sufficient liquidity from Operating Earnings (EBIT) in order to meet its continuing debt-service obligations, particularly interest payments, timely and fully. The two most common solvency ratios have to do with “leverage,” or the extent to which the firm employs debt as a source of capital as opposed to using equity.
Some debt is desirable as it allows the firm’s owners or shareholders to exploit “other people’s money” (OPM) in order to earn greater profits on a per share basis than they would in the absence of debt, i.e., OPM. Too much debt, however, may be a bad thing as it increases the firm’s riskiness by adding on an increasing requirement to pay interest on the debt.
“TIE” Ratio = Times Interest Earned (or Interest Coverage) = EBIT ÷ Interest Expense
EBIT stands for “Earnings before Interest and Taxes.” Over time, a company’s operating earnings (EBIT) may fluctuate, the extent of which fluctuation depends on the company’s business and its industry. For example, a lawnmower (or snowmobile) manufacturer will have high sales and inventory at certain times of year and low at other times; we refer to this phenomenon as “seasonality.” The company’s interest expnses is relatively flat over time because the company does not often borrow and its interest expenses are fixed.
In any case, this ratio looks at the extent to which EBIT exceeds the interest expense on its debt over time. Is this margin (or buffer) a “safe” amount? (Some analysts will add back depreciation and amortization to EBIT to arrive at “EBITDA” – operating cash flow – on the rationale that interest is paid with cash.)
In the diagram below, you will find inserted three possible EBIT curves for a fictitious firm; each possibility is represented by a different colored curve.. The “wavier” the EBIT line, the more volatile its operating earnings are/will be over the course of some periods or years. The question is: overall, which curve represents the most secure TIE ratio and why? The implications profoundly relate to the firm’s Solvency!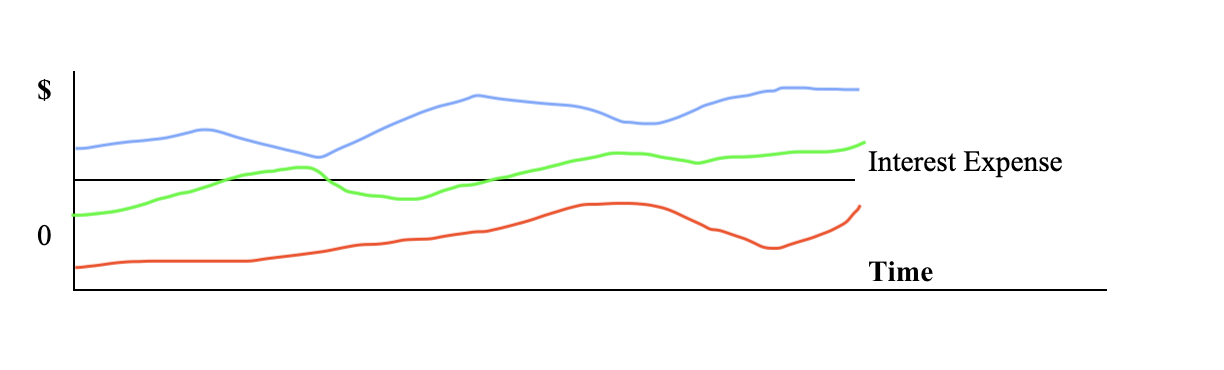
EBIT may look like a kind of horizontal squiggle, the squigglyness of which depends on the volatility of the firm’s operating earnings. The question then is whether interest expense (the straight horizontal line), which should be relatively flat over time, is above, below, or somewhere in the middle of the squiggle. Interest expense would appear as a horizontal line, since it is relatively flat over time because the company’s level of indebtedness changes little, if at all, over time.
Again, the company’s EBIT should be sufficiently above the interest expense line, the extent of which differential depends on the nature of the company’s business and the manner in which the company is managed. A contingency may arise that if EBIT is low relative to (or worse, below) the interest expense, will the firm have the capacity to make the required and timely (cash) payment of interest? Persistent insolvency may lead to bankruptcy.
Debt ÷ NW
By “NW,” we mean “net worth,” or (total) “equity” (remember the basic accounting equation: A – L = NW). Analysts will disagree as to what is meant by “debt.” Some will concern themselves only with long-term liabilities; others will include current liabilities among “Debt.” In most instances, and for our present use, we will refer to “total liabilities” as debt, a reasonable default assumption since Debt + NW = 100% of assets, thus excluding nothing on the Balance Sheet.

While one cannot say what the ideal “debt-to-net-worth ratio” ought to be, it is safe to say that as the ratio increases, the company’s ongoing ability to service its debt (i.e., to pay interest in particular) is reduced, and the likelihood of bankruptcy increases. In general, the ratio will change from industry to industry. Some industries are characterized by greater indebtedness, or “leverage” than others. We will have more to say about this later. This ratio may be less than or greater than one. In the Balance Sheet to the right, the Debt-to-Net Worth Ratio is 500:500 or 1:1, “one to one.” The Total Assets are $1,000.
Debt ÷ TA
The default option for defining “debt” is again “total liabilities.” Again, remember that Total Assets = Debt + Equity (TA = D + Eq). In this case, as the ratio increases, the company’s solvency becomes increasingly at risk.
This ratio should not be thought of as “coverage” ratios, in the same sense that the current and quick ratios are (or for that matter as the TIE ratio is). In the latter cases, we view the adequacy (or inadequacy) of current assets as sufficient – or not – to pay for the company’s current liabilities. The firm needs liquid current assets to pay off its current liabilities.
Such is not the correct manner, in which to interpret the debt ratios. The company does not need its equity to “pay off” its debts! It is incorrect to say that the net worth, or equity, of the company is “adequate” in this sense. The only time that that equity will be used to pay off debt is in the worst case of bankruptcy and (net) asset liquidation! In most cases, you will be analyzing an ongoing enterprise, not a bankrupt one.
Instead, these two debt ratios (D/NW and D/TA) are simply measures of the magnitude of a company’s indebtedness and, as such, are useful in comparison to other companies in its industry, and to itself over time. Does XYZ Corporation have a lot of debt in comparison (or in proportion to) to its industry peers? Is its indebtedness increasing?
A more useful solvency coverage ratio, if you are looking for one that most directly addresses solvency, is the “Times Interest Earned” ratio, above. The “TIE” ratio provides a gauge of the company’s ability to pay (i.e., to “cover”) the interest payable (or paid) on its debt.
The D/TA ratio above would be 500/1,000 or 50%. While the D/NW is more popular, the D/TA ratio gives the analyst an imaginary range of 0-100% of debt in comparison to total assets. The D/NW ratio gives no such reasonable range. In any case, one ratio can be easily inferred from the other.
Total Assets ÷ Equity
Another solvency ratio is D / TA. This ratio will be presented and discussed when we get to the “DuPont Model” somewhat later (see Sections 6.3 and 6.4).
![]()
Leverage
In summary, the more debt a company has relative to either its Equity or its Total Assets, the more leverage it is said to have, by definition. In Physics, a “lever” allows one to get more output with the same input as compared to not using the lever.
“If at First….”
I can accept failure; everyone fails at something.
I cannot accept not trying.
-Michael Jordan
I have not failed. I’ve just found 10,000 ways that won’t work.
-Thomas A. Edison
