9.8 EFN Solution
EFN = [(A0/S0) ΔS] – [(AP0/S0) ΔS] – [(M0) (S1) (RR0)]
= [(1,000/2,000) (500)]– [(100/2,000) (500)] – [(50.40/2,000) (2,500) (0.70)]
= $250 – 25 – 44.10
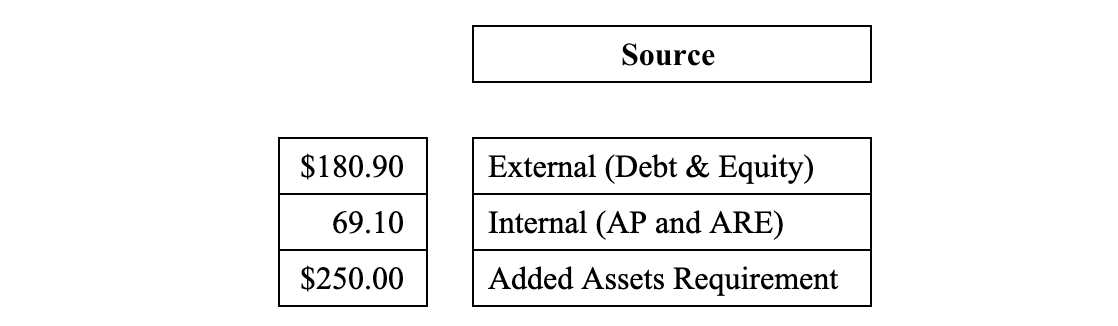
= $180.90
Question #1: What does this number mean?
Answer: It means that, if my company wishes to grow its sales next year by $500, it will need to add on $250 worth of assets, of which $180.90 will be funded externally.
Remember: If it wishes to increase assets by $250 in order to achieve its sales objective, it will have to increase the other side of the balance sheet by the same amount. In this case, $25 will be provided internally by accounts payable, $44.10 will be provided internally through retained earnings, and $180.90 will be provided externally by some mix of debt and equity.
Note 1:
- Use spontaneous changes only, that is, AP for liabilities, exclude Notes Payable (NP) and Long-term debt (LTD).
- This was based on a static ratio analysis – our restrictive assumption.
- This has been an incremental analysis; we were only interested in the additional amount of funds needed, and that’s what we got!
Question #2: How much of the $180.90 will be externally funded by debt and how much by equity?
Question #2, Answer 1:
The present debt/equity ratio is 3:7, i.e., 30% debt and 70% equity. Total capital is $1,000, with $300 of debt and $700 of equity (D ÷ TA = 30%). Assuming static analysis, 30% of the $180.90 will be financed by debt and 70% by equity. This will maintain the capital ratios in the same proportions as prior to the new external funding.
Question #2, Answer 2:
Another, perhaps better, way of calculating the debt ratio, for this purpose, would be by excluding internal capital from the figures. In this way, we would be establishing only how much external debt and external equity should be raised, an approach, which would be more consistent with the purpose of the EFN formula. We agreed that the firm needs $180.90 of external funds.
Thus presently, external debt ÷ external equity = 200 ÷ 500; that is 28.5% (2/7) in debt as compared to the total of external capital. We had raised $2 of external debt for every $5 of external equity. Total external capital was $700 (5/7) (not the $1,000 in total capital used in the prior calculation). In this alternate calculation, we have ignored internal accounts payable ($100) and retained earnings ($200). Incremental internal funds will be provided over the coming year as in the past.
Below we illustrate both answers. 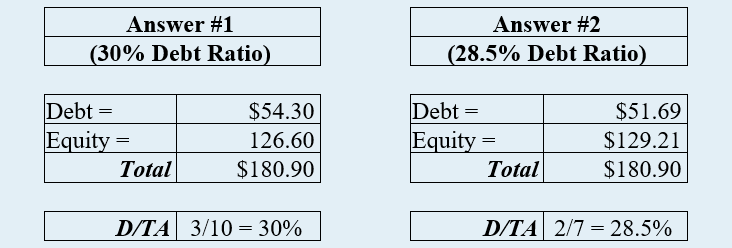
Note 2:
In the first two expressions in the EFN model, i.e., [(A0/S0) ΔS] and [(AP0/S0) ΔS], we utilize the incremental, projected sales increase (i.e., ΔS) whereas the third portion [(M0) (S1) (1 – PR0)], we utilize the entire projected sales amount (S1).
Why, in fact, may Financial Ratios change?
In the foregoing analysis, we assumed that financial ratios do not change over time. In fact, ratios are dynamic. Here are some reasons why, in fact, ratios will change.
-
- Economies of scale – as companies grow larger and produce more, they benefit, according to Microeconomic theory, from lower production costs per unit produced, even though total (production) costs are rising. The phenomenon will continue until the firm reaches full capacity and needs to add on assets in order to continue growing. The Asset/Sales and Profit ratios will be affected. Assets will remain flat as sales grow – until full capacity is reached. With unit costs down, gross profits will increase.
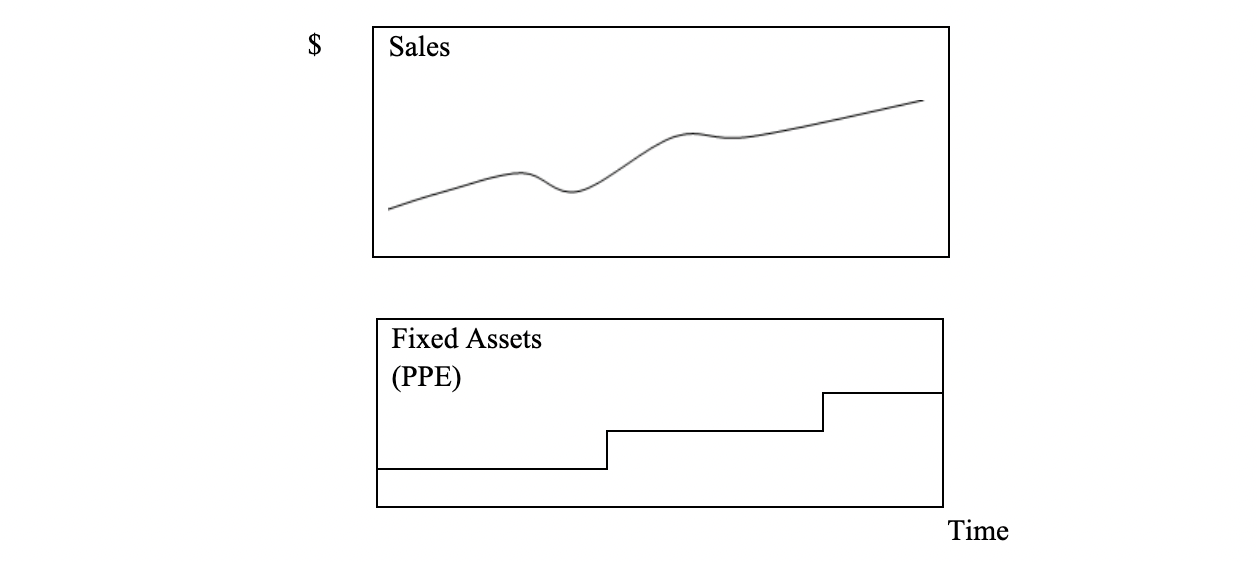
- “Lumpy Assets” i.e., firms may reach a level where they have to acquire more (expensive) assets (assets don’t grow smoothly or in the same proportion as the sales increase, which is likely smoother). For example, the factory may be at only 60% of capacity, which affords substantial growth in production and sales without adding on capacity or expanding to an additional facility. Should sales continue to grow beyond present capacity, it would be incumbent upon the firm to add to its fixed assets at some point. Such assets would suddenly jump in size. Sales, by contrast, may grow relatively smoothly over time. The Sales/Total Asset ratio will provide some insight.
- Capital Costs (i.e., the economic costs to the corporation of borrowing money and issuing stock) will likely change over time – interest rates will go up and down, causing changes in the cost of debt, borrowed money. If the cost of debt decreases, after-tax income may increase. It will then be cheaper to finance new fixed assets, so the firm may then decide to add on more P, P, & E. The T.I.E. Ratio (EBIT / Interest Expense) may provide some added insight here. Also, stock investors will demand that the company produce dividends and increased profits – to be retained if not distributed as dividends. Additions to Retained Earnings will increase the company’s value and hence its share price. (Capital Costs should not be confused with Capital Assets Costs.) In short, what investors require or demand, the corporation must provide; return to the investor is an economic cost to the corporation.
