9.2 Free Cash Flow
Why Cash Flow? A corporation’s value is dependent, in large part, on the income and cash flow it produces. Cash flow is different from income in that “income” is based on “accrual accounting,” which will reflect certain non-cash events such as depreciation, and many other “distortions,” some of which were discussed earlier. One key distortion had to do with “timing” – the accountant may book a sale, for example when “constructively received,” i.e., when legally and economically receivable, but not yet received in actual cash.
Under accrual accounting, the accountant records economic transactions rather than the movement of actual cash received and paid out. (In theory, in the long run such accounting vs. cash differences even out.) Because of these differences, financial analysts, who are more cash-oriented, must make certain adjustments to the accounting data in their own calculations and projections.
In a certain sense, cash flow is more important to corporate valuation than income because dividends are paid out to investors in cash. Further, when engaging in corporate planning, a possible capital investment will be judged attractive dependent upon the cash flow it produces in the future because it is cash that, arguably, fuels growth.
What is Free Cash Flow? Capital investments, i.e., “growth” investments, include expenditures for hard assets, as well as for product development, and much more. “Free cash flow” is funds that an investment project or the corporation as a whole generates beyond its own internal and ongoing needs. We may think of free cash flow as the cash, which is left over from an investment project, after all net operating funds generated by the project are utilized for necessary, non-discretionary purposes, including hard assets’ maintenance and replacement, and increases in working capital; this “left-over” amount may be used for other financial purposes – growth or expansion, at the discretion of management.
Working capital must often be increased. The project, or corporation, first generates operating cash flows, some of which are needed to replace or maintain assets, to invest in inventory and receivables, and to maintain the firm’s competitive position.
So, think of “free” cash flow (FCF) as discretionary, think of it as “Discretionary Cash Flow.” Necessary capital and other non-discretionary expenditures are required in order to maintain the business as is. A leaky roof must be repaired; there is no choice. A worn-out gasket must be replaced.
Analogously, you may recall the parallel notion of “disposable income” in Macroeconomics. (After deducting taxes, and necessities, such as food and rent, from gross income, the consumer has some funds left over for discretionary purposes, which might include investment, or buying that deluxe Apple Watch s/he has coveted for so long.) Similarly, “free cash flow” is the net, operating after-tax cash that the firm may generate from investment in a new building or equipment (i.e., the investment “project”) after considering necessary operating and capital expenditures, including maintenance and replacement, but excluding expansionary, or growth-oriented, capital expenditures as this would be discretionary.
The more FCF the firm generates, the greater the firm’s ability to invest in new assets, to use the funds to pay down debt or to pay dividends, and still other discretionary possibilities.
The Mathematics
One formula for use in this process is presented below. We start with operating earnings, which, in this case, is defined as “EBIT” or, alternatively “EBITDA[1],”i.e., earnings before interest, taxes, and amortization[2]. To the financial analyst, the projected income or cash flow statement may look something like the following:

Thus the analyst would calculate Free Cash Flow (FCF) to equal:
[(EBITDA) (1 – T)] + [(Depreciation) (T)] – [Necessary Capital Expenditures] – [Increase in Net Working Capital]
The elements of the formula
The formula consists of four different parts. Let’s look at each of them.
- EBITDA (1 – T)
- Add: Depreciation (Tax Rate) = (D) × (T)
- Less: Necessary Capital Expenditures[3]
- Less: Increases in Net Working Capital
- Equals: Free Cash Flow (FCF)
Note that “T” (in “1-T” and in “D x T”) stands for the firm’s tax bracket, or percent, whereas EBITDA is in dollars, including the “T” there. While at this stage of the corporate planning and investment analysis process, the firm has not yet decided whether it will choose the investment or not and, if so, how it will be financed, and therefore does not know its projected interest payments, it does know its tax bracket, which is based on the firm’s meeting a specified lower threshold (“bracket”) of earnings.
1. EBITDA:
Take note of the use of EBITDA rather than EBT in the formula. There are several details here, which bear explanation; we will take them one at a time. First, accounting EBT would include interest expense – as a deduction from EBIT. “Interest expense” is the result of a prior capital financing decision and, as such, should be independent of this analysis, which focuses on the cash-based, operating earnings a firm or a project produces (EBITDA), and not on financial decisions. In our analysis and projections, we should thus exclude interest, which is a discretionary capital structure, solvency-oriented matter for decision.
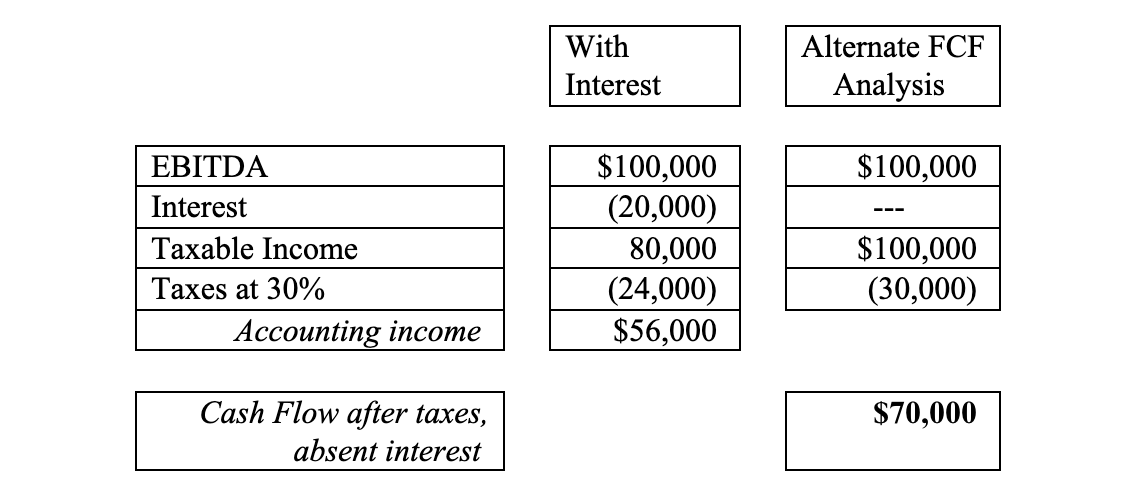
Accordingly, the “EBITDA (1 – T)” adjustment eliminates the interaction of interest and its effect on tax. To see how this adjustment works, let us compare the results of the formula with the following alternate spreadsheet presentation. Let’s say that the firm produces $100,000 of EBITDA, has interest expense of $20,000, and pays taxes at a 30% rate. By formula we would project EBITDA (1 – T) = $100,000 (1 – .30) = $70,000. (For this example, we shall assume, for the moment, that depreciation and amortization are zero.) This is the figure we want, which represents earnings after taxes, in the absence of interest. The “1 – T” multiplier shows what is left after paying taxes. This project produces, or is expected to produce, $70,000 in operating cash flow (next year).
In the following spreadsheet, we would show the same $70,000 result, only by different presentation (in order to prove out the formula) – under the alternate FCF analysis. We also show, side by side, the accounting income reported, which does not suit the purpose of the analysis because it includes interest expense, which is a financial – not an operating – event or cash (out-) flow.
2. The Depreciation Tax Shield:
Depreciation is a non-cash expense (as is amortization, which we have been assuming herein to be zero), which is deducted from operating earnings before income taxes. Therefore, we add back just the tax savings that depreciation provides but ignore depreciation itself. It is assumed that the (internal) analyst knows the firm’s tax bracket. Depreciation is tax deductible and, as such provides cash, but otherwise itself directly provides no cash. You found above an in-depth illustration of the “tax effect of depreciation,” absent other media. You may wish to view that page again now.
Note:
3. Capital Expenditures:
There are the three categories of capital expenditures (“Cap Ex”), which we shall need to incorporate in the free cash flow projection. They are:
1. Maintenance 2. Replacement 3. Expansion
Occasionally, the walls must be painted and the premises properly maintained. Roofs may blow off, and machinery gaskets may “blow,” requiring replacement. Expansionary investments may involve acquiring additional factory space or equipment, in order to increase production, and hence sales and profits.
Maintenance and replacement expenditures are clearly necessary; expansionary expenditures are discretionary and are (generally) undertaken in order to provide growth, i.e., increased sales and profits. We would deduct necessary capital expenditures in order to arrive at free cash flow.
Accounting rules do not require separating out necessary from discretionary capital expenditures; any breakdown, if provided, may be found in the footnotes. This information will assist the analyst in gauging the firm’s growth prospects. Absent this breakdown, the most common practice among analysts is to use all capital expenditures in the formula, although this is a matter of analyst judgment.
4. Net Working Capital:
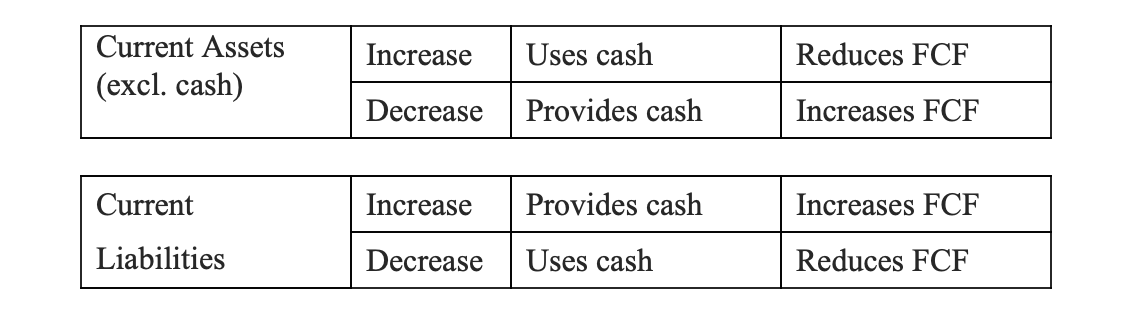
“Net working capital” may be defined as current assets less current liabilities (NWC = CA – CL). Any increase in current assets, or in net current assets (i.e., “NWC”), uses financial resources and thus reduces cash or cash flow. For example, an increase in inventory uses funds.
Similarly, an increase in current liabilities provides funds, and may be thought of as a “source” of funds. A decrease in current liabilities uses funds. For example, when a company pays its accounts payable, it uses funds.
If a firm is to grow it will have to increase its Net Working Capital.
The table below summarizes the possibilities and instructs you how to insert the changes into the FCF formula. Some add to FCF; others are subtracted from FCF.
Note that, in calculating Free Cash Flow and the relevant prospective changes in Current Assets, we ignore expected changes in the cash account, focusing instead on changes in the cash flow affecting the cash account. To include changes in the cash account itself in calculating FCF, would be “double-counting.”
What can the corporation do with its FCF?
- Purchase more P, P, & E.
- Expand inventory.
- Invest in Mergers and Acquisitions (using shares when high-priced).
- Increase R & D.
- Pay off Debt.
- Pay discretionary (common stock) dividends.
- Buy back common shares (when cheap).
A potential corporate investment project that throws off a lot of FCF is desirable. A firm, as a whole, that throws off lots of FCF may be thought of in a most positive light – as one, among other possibilities, that has a lot of growth potential and makes for a good investment.
- In some instances, an analyst may choose to use “EBITDA,” i.e., EBIT with depreciation and amortization added back. The use of this figure will depend on the data presentation and analyst choice. ↵
- As we will learn later in this text, amortization has to do with the reduction in the value of an intangible asset over time; in this sense it is like depreciation. ↵
- Note that “Capital Expenditures” here refers only to required expenditures, i.e., maintenance and replacement expenditures, and not discretionary expenditures, which may be used for expansion and growth. By subtracting out necessary (i.e., non-discretionary) CE, we are left with Free CF. ↵
