3.2 The Income Statement
Income statements, in contrast to the balance sheet, are “flow” statements, and are thus not static like the balance sheet; think of it instead as a moving picture, rather than as a photograph. The income statement will reflect cumulative data for a period ending on a certain date. The “period” has a starting and ending date; it may cover a year, half-year, quarter, or even a month.
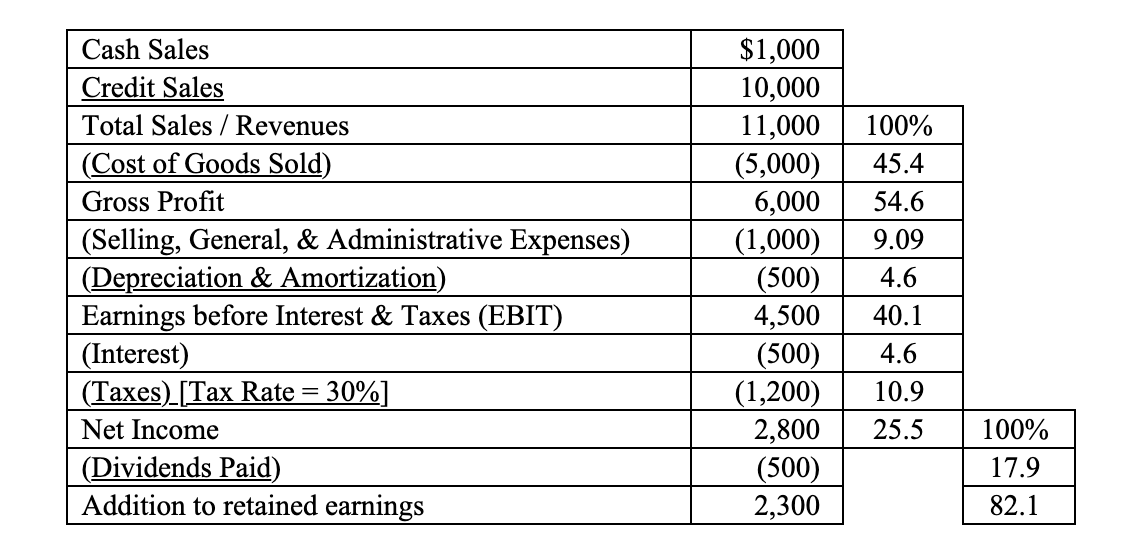
Over the course of the period, the numbers, whether they be revenues or expenses, will grow only larger. The sole exception to this is the profit figures, including gross profits, earnings before interest and taxes (EBIT), and net income. These data may go either up or down depending on the relative growth of the revenues and expenses that make up those “net” figures. That is, if revenues grew less than expenses over a period, the net profit may go down over time. Take note that expenses are bracketed numbers to indicate that they are subtractions from revenue in order to arrive at profits.
Again, all other entries are the result of the accountant’s summarization of revenue and expense bookkeeping entries, which only grow in size over time (with some few exceptions). Profits are merely the calculation of differences between revenues and expenses in the summary income statement. If expenses grow faster than revenues, profits may decrease in time.
In contrast, balance sheet numbers will change, in theory, daily, and may either increase or decrease. At the year’s end, the “books are closed” and all the income statement numbers revert to zero; we start all over again. The balance sheet, in contrast, never reverts to zero; the company always has some assets and liabilities. A very simple income statement will look something like the following:
XYZ Corp. Income Statement for the Year Ending 12.31.XX
![]() Key Terms:
Key Terms:
Common Size Statements
You must note that expenses are bracketed as they are reductions (subtractions) to revenue in arriving at the profits numbers, i.e., Gross Profits, EBIT, and Net Income.
The key connection between the income statement and balance sheet has largely to do with “addition to retained earnings.” When the books are “closed” at year’s end, this addition (or deduction) is transferred to “retained earnings” in the balance sheet; the income statement is “closed out,” and everything in the income statement reverts back to zero. If dividends are paid when there is a loss, the cash used to pay the dividends will have to come from (past years’) retained earnings. “Retained earnings” represent the accumulation of historically retained profits, which were not paid out as dividends, but instead were retained by the corporation, since the corporation’s inception.
As an accountant (or financial analyst), you may think of revenues as credits (right hand) and expenses as debits (left hand) of the “T-accounts” to which reference was made in the prior chapter. Think of the income statement as part of the balance sheet’s equity section, which is also a credit balance account. When numbers are compared to a base figure, in this case either “total revenues” or “Net Income,” the analysis may be referred to as “Vertical Analysis.” This makes the analysis from one company to another simpler. Matters having to do with the relative magnitude of the data from one company to another are thereby neutralized. Such analysis utilizes Common Size Statements, where figures are represented in percentage terms, as in the income statement above. Common size statements are also (very occasionally) used for Balance Sheets.
Getting back to debits and credits, at year’s end, the accountant debits the income statement for an amount equal to the “addition to retained earnings.” Remember that the Income Statement is a credit balance statement. This debiting enables the accountant to set the income statement back to zero. (Again, the balance sheet never reverts to zero, except in the extreme case of bankruptcy liquidation.) S/he then credits the balance sheet’s retained earnings account for this same amount. That is how retained earnings grow (or decrease when there is a loss and retained earnings are thus negative) over time. The additions to earnings should be reinvested by a good management in profitable assets for corporate growth purposes.
“EBIT” may also be referred to as “operating earnings.” As you will see, we will differentiate between operating earnings, i.e., earnings generated from the firm’s business activities, and other non-operating income. There are a few other basic things that the financial analyst must keep in mind relative to the Income Statement.
![]()
Credit Sales
Credit sales (on the income statement) are recorded as accounts receivable (on the balance sheet) – until the receivables are collected. This is typical of accrual accounting, as opposed to cash accounting, the latter of which recognizes a sale only when cash is exchanged. At the time of a credit sale, credit sales are “credited” on the books, and accounts receivable are debited. When the customer pays, say in 30 days, the account receivable is credited and the cash account is debited.
![]()
S, G, & A
Selling expenses include advertising, salesperson’s salaries, and “freight-out” paid on shipments to customers; an exception is “freight-in” payments, which are paid on shipments to the firm and are included in COGS (cost of goods sold). General and administrative expenses have to do with: clerical and executive offices salaries, outside professional services, telephone and internet, postage, and office equipment depreciation. Selling, General, and Administrative expenses are also known as S, G, & A.
![]()
Depreciation
Imputable
Depreciation, if imputable to inventory production, will be included in COGS. By “imputable,” it is meant that the accountant can objectively ascribe a specified dollar amount of depreciation to a specified dollar amount of production. Imputable means that units produced can be associated and measured with mathematical certainty and precision to units of production. This figure would be added to COGS, rather than reported separately lower down on the Income Statement.
For example, if an equipment manufacturer warrants that a $1 million-dollar machine (at cost) will produce one million units and then need to be scrapped, we can safely say that each unit produced includes one dollar’s worth of depreciation. This may happen in the case of depreciable equipment, but not with the plant. Otherwise, i.e., if not imputable, depreciation will be reflected separately and visibly below the gross profit line.
This makes matters confusing to the reader. Depreciation may be included “above” (within COGS) and/or “below” the gross profits line (as “depreciation expense”). If the former, it will be included within the COGS number; if not, it should be reflected as a separate line item lower down the income statement.
![]()
EBIT
Operating Earnings
EBIT or Operating Earnings should be viewed as a kind of dividing line within the income statement. Everything “above the line,” has to do with the firm’s basic running of the business, or operating revenues and expenses. Those items that appear “below the line” may include numerous non-operating items. Such items may include interest on debt, a profit or loss from the sale of an asset, or the financial outcome of litigation. Interest (on debt) has to do with a financial matter; this is not a matter having to do with the running of the business, but instead, with the decision as to how the firm’s assets are financed, in this case with debt rather than with equity. Analytically, it is important to the financial analyst to differentiate between operating and non-operating; we shall depend on this differentiation often.
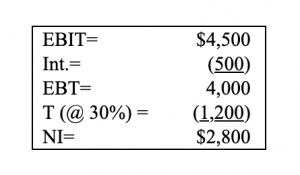
Taxes are based on earnings before taxes (EBT), which are not always shown on income statements as a separate line item. Here, EBT, i.e., EBIT ($4,500) less interest expense ($500), but before taxes, equals $4,000. You should also note that taxes were calculated using a 30% tax rate (i.e., a rate arbitrarily chosen for this example), i.e., $4,000 × 30% = $1,200.