7.4 The P/BV (Price-to-Book Value) and P/E (Price-Earnings) Ratios
The price of a stock alone does not tell you anything about its value. Take two stocks, one of which is trading at $20 and has 1,000,000 shares outstanding, while the other trades at $10 and has 2,000,000 shares outstanding. Which one has greater value? They are both the same!
Instead, we will look at relative value, i.e., price relative to either of two measures: Book Value (BV) per share and Earnings per share (EPS). Book Value per share is measured by the accountant’s assessment of the company’s equity (excluding preferred stock, if any) divided by the company’s number of (common) equity shares outstanding (NOSO). We already know how to calculate EPS.
Let’s take the example of two companies that have the same share price, the same number of shares outstanding, but different book values per share (i.e., assets minus liabilities divided by the number of shares outstanding). Which stock is a better “value”? Which is a better investment?

At the same price, it seems that LCM is a better buy. LCM provides greater BV for each dollar of share price. Clearly, while the market price alone does not necessarily tell you whether the stock is a “good buy” or not (both stocks here have the same price), there is also some question as to whether Book Value is a reasonable measure.
The balance sheet perspective (i.e., “accounting book value,” or the company’s net assets) depicted above is fraught with the many interpretive accrual accounting problems enumerated earlier (specifically, we enumerated four issues). There is likely more historical bias embedded in book value than in earnings. On the other hand, Price-to-Book (P/BV) tends to be a more stable measure than the PE ratio. Further, P/BV ignores how well management utilizes the assets in producing earnings for shareholders. Earnings certainly matter! Earnings are what most shareholders focus on.
Summary: Price-to-Book Value
Pro
- More stable than PE
Con
- Subject to accrual accounting idiosyncrasies
- Most shareholders focus on earnings
- Ignores management effectiveness
-
- Asset utilization
-
- Earnings production
Another way of making the assessment of whether the stock price is “fair” or not, would be by looking at the stock’s P/E ratio, i.e., Price (per share) ÷ Earnings (per share). How much does the prospective (or current) shareholder pay for a share of the stock in order for him to “earn” so much in terms of EPS? Remember that the shareholder is most interested in earnings per share because that is the source of his dividends and retained earnings, a portion of which he owns. In contrast to the first approach, this approach is income statement oriented. You should be able to calculate EPS and PE independently.
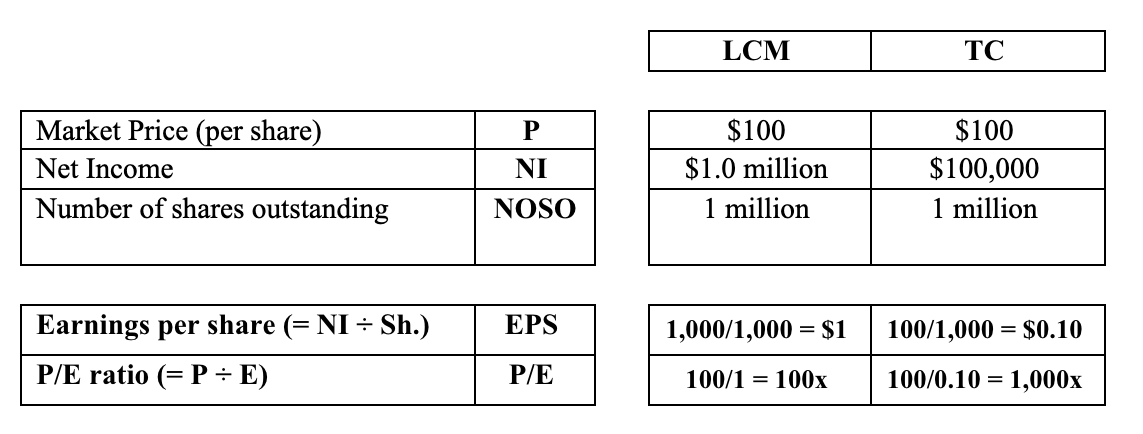
EPS are $1 and $0.10 per share for LCM and TC respectively. Clearly, however, LCM is “cheaper,” with a PE ratio of 100x earnings, whereas TC reflects a ratio of 1,000x its earnings – if you accept PE as a valid valuation/pricing measure. (The PE ratios presented in this example are much higher than will be typically found in the markets – even in good times.)
Earnings are important because when an investor purchases a stock, s/he is making an investment in the company’s ability to generate profits. (This is not to say that the assets have no value.) The profits, in turn will be either distributed to the shareholder as a (cash) dividend – or retained by the corporation and then reinvested in additional assets that should produce even more profits going forward.
Again, in purchasing LCM stock, the investor is paying “only” $100 for every $1of earnings in comparison to paying $1,00 per $1 of earnings in the case of TC. LCM is clearly “cheaper.”
We have already cited the basic problems in utilizing (legitimate) accounting data in the course of financial analysis. Was “book value” useful in this example? In recent years, management and its accountants have been very “creative” in the presentation of accounting summaries. Is EPS reliable accounting-wise? The analyst has to be cognizant of alternative accounting presentations – both legitimate and not.
Note regarding EPS calculation:
The calculation for EPS presented above (i.e., net income ÷ the number of shares outstanding) is simplistic and should be used only when better data are not available.
In fact, the accountant will present both “Basic” and “Diluted” EPS, the calculations for which are quite involved. The student analyst must choose whether to utilize the Basic EPS datum in calculating the PE ratio or the Diluted version.
The Diluted datum assumes that convertible and other “complex” securities have been converted to stock; this results in a lower EPS number. The theoretical supposition inherent in the Diluted earnings figure may make it inappropriate for use in PE valuation in the eyes of some analysts.
